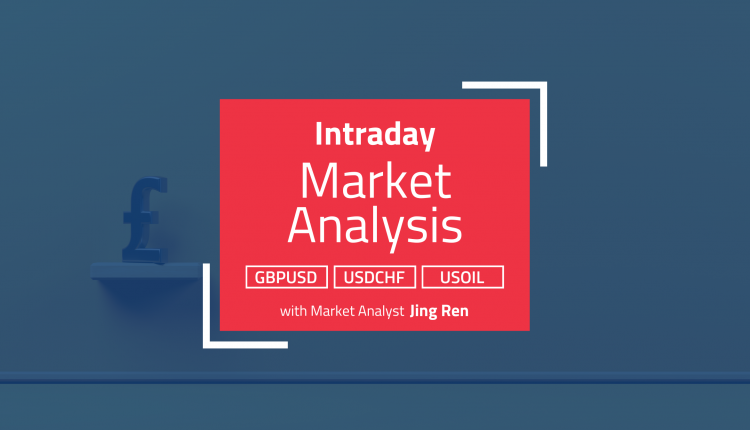
GBPUSD tests key support
The pound slipped after January’s CPI came out below expectations. On the daily chart, the pair is still range bound between January’s low (1.1850) and high (1.2450). For intraday traders, a shooting star in the supply zone (1.2260) from a faded bounce indicates solid selling interests. The previous swing low of 1.1960 is a key level to keep the rebound valid. A bearish breakout may trigger a new round sell-off to the critical floor at 1.1850. As the RSI bounces back into neutral territory, 1.2070 is the first resistance.
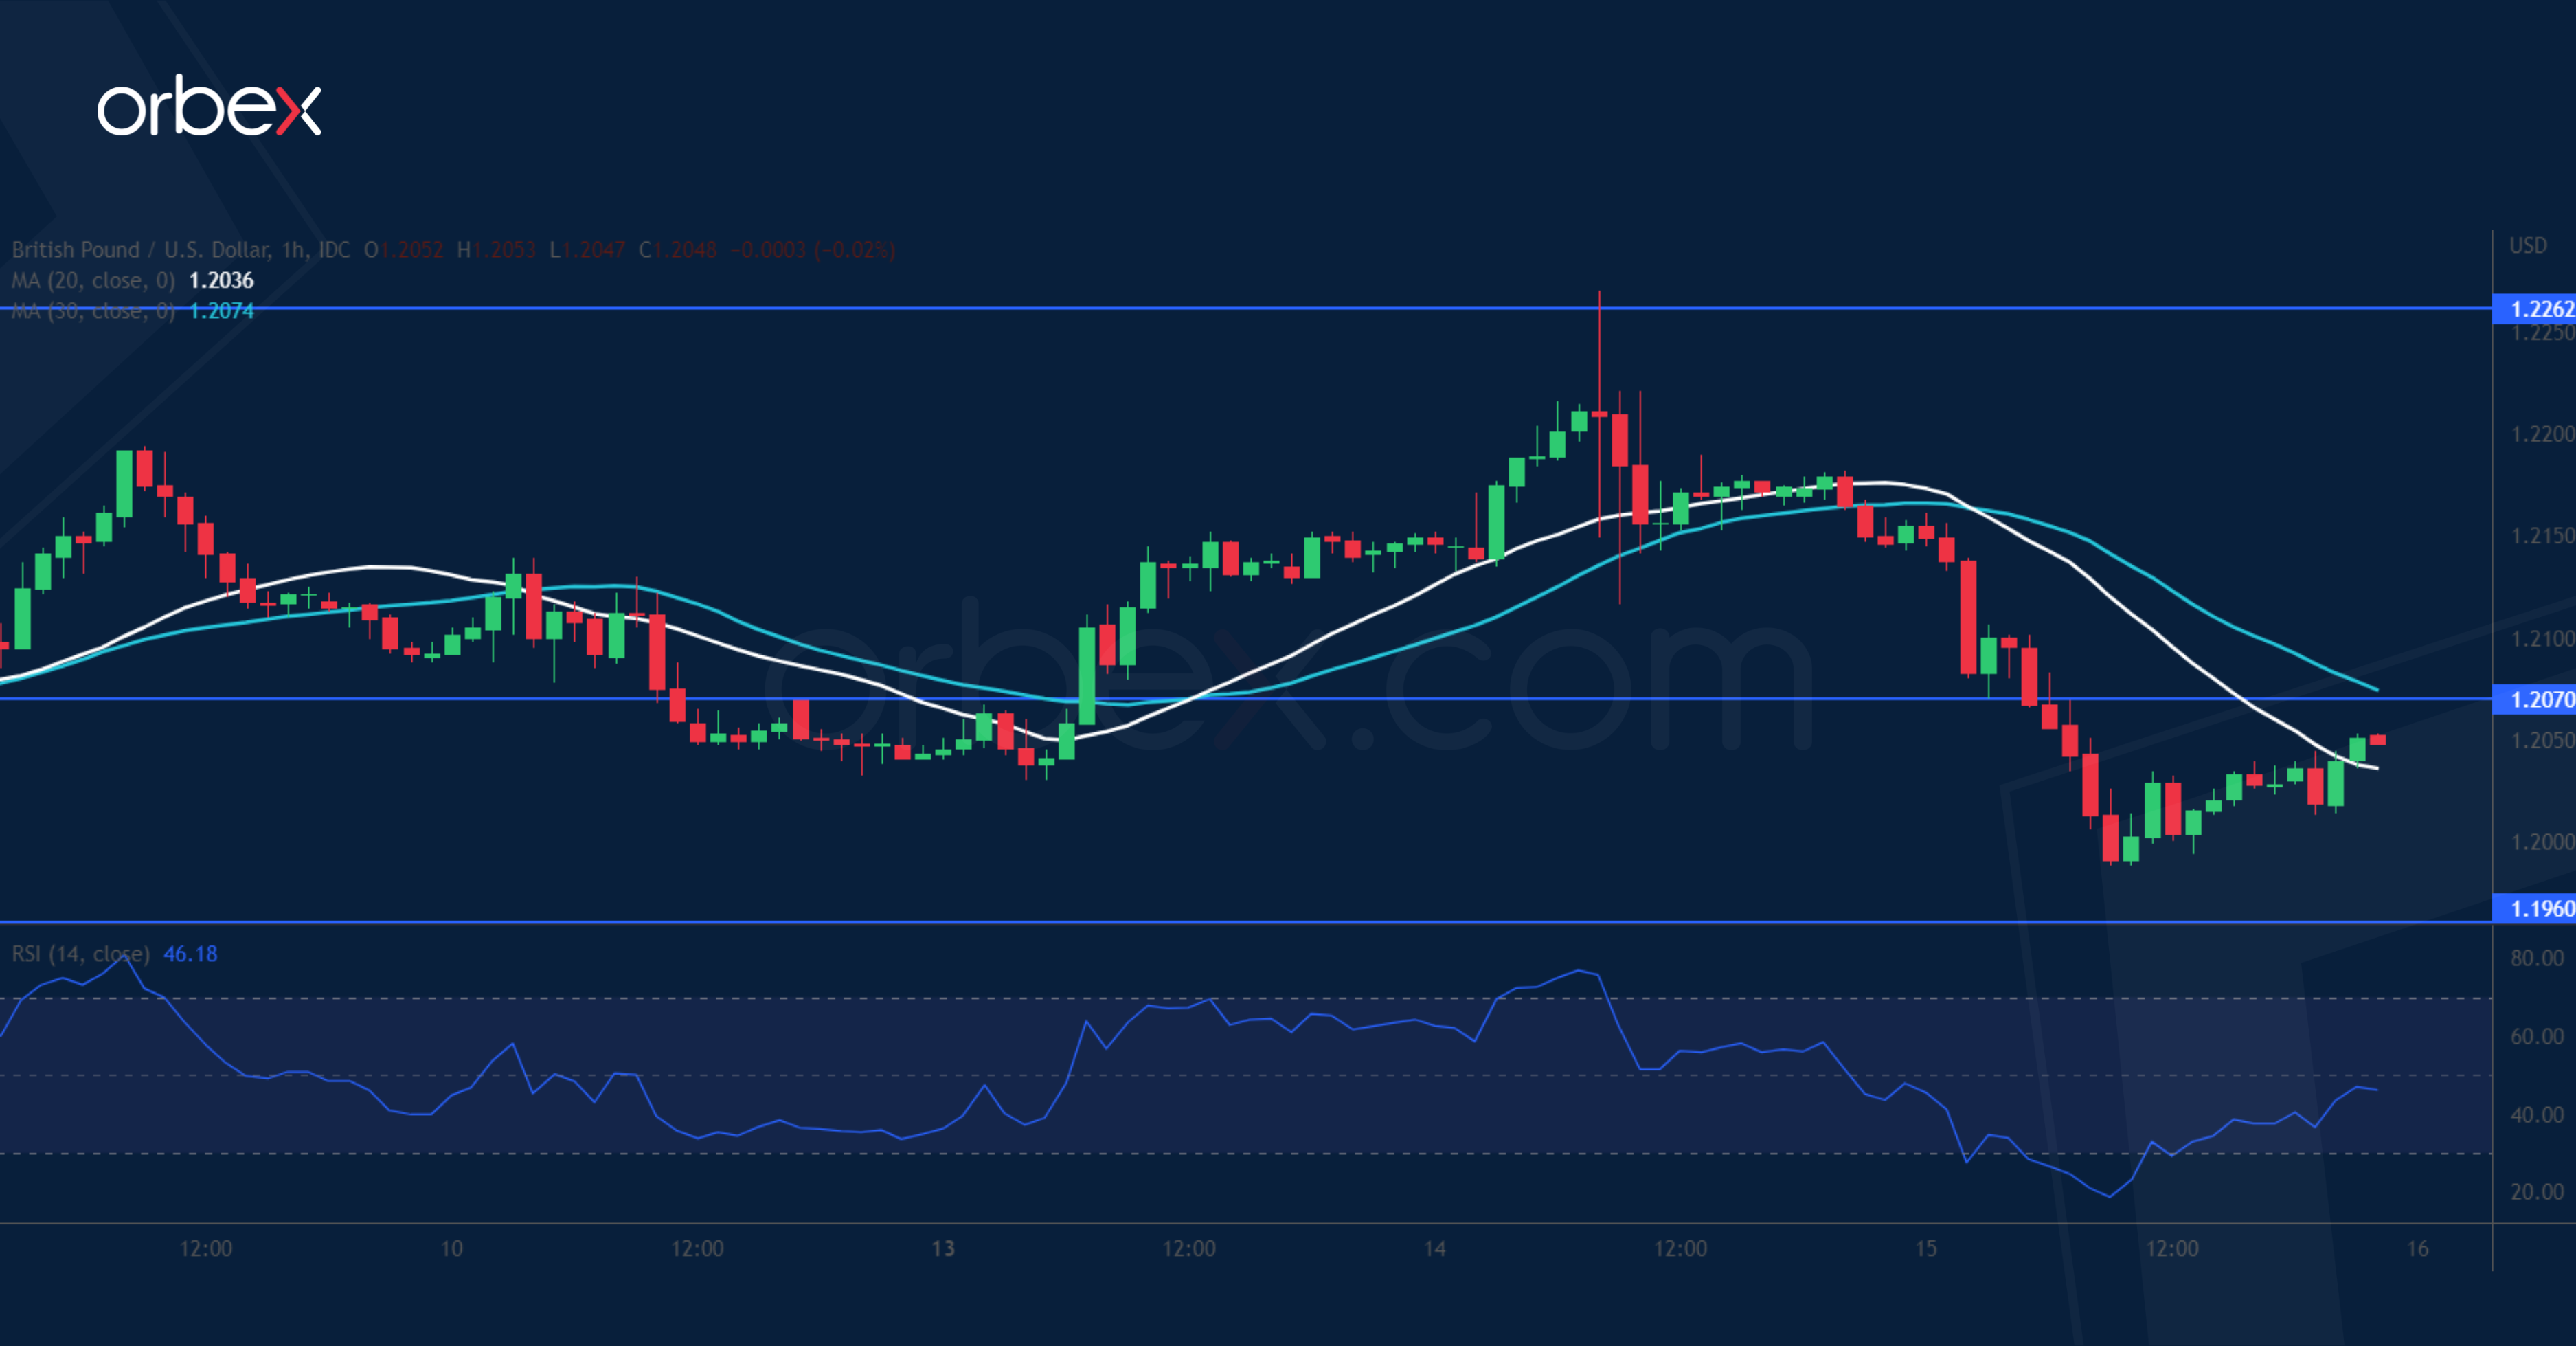
USDCHF attempts to recover

The US dollar advances over robust retail sales figures in January. The selling pressure has eased after the pair tentatively broke above 0.9290 last week. The subsequent fallback found bids at the former resistance near 0.9150, keeping the buy side in the game. 0.9210 is the closest support. The supply zone around 0.9290 is sellers’ last stronghold and its breach would attract momentum buying and open the door to January’s high of 0.9400, and that would be a step closer to a bullish reversal in the medium-term.
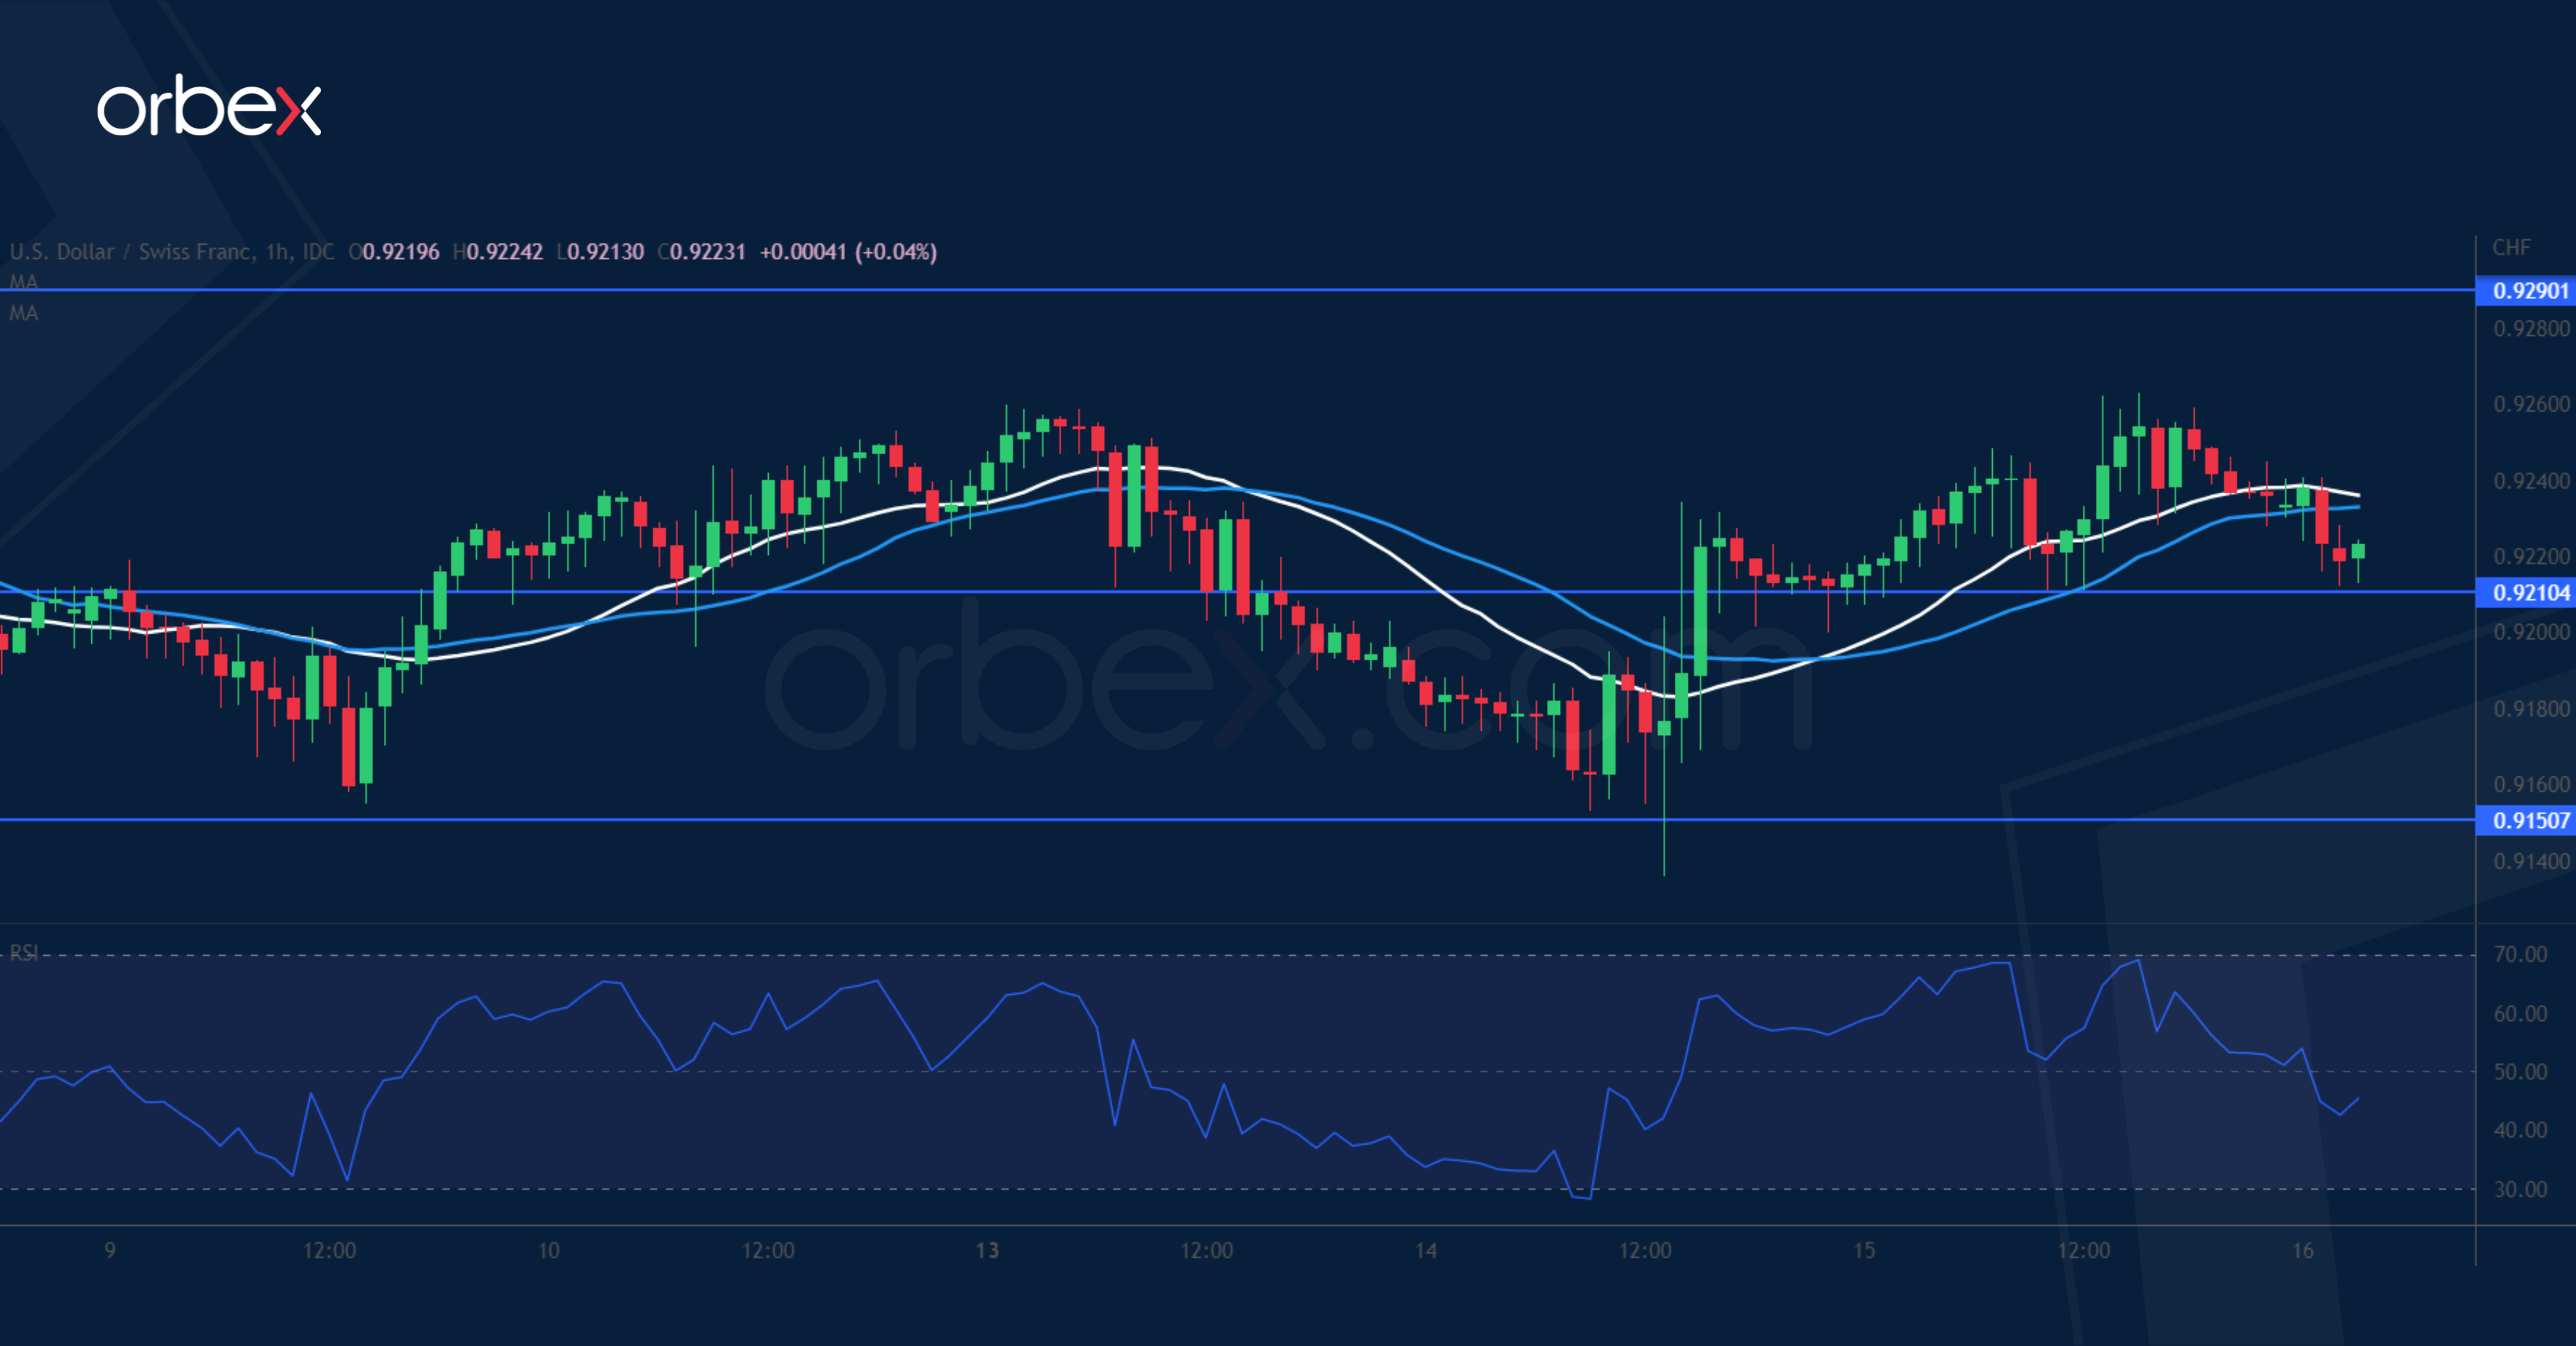
USOIL hits resistance
WTI crude struggles after a huge buildup in US stockpiles. The price action is still in a recovery mode following the late January sell-off. The choppy grind into the supply zone around 80.50 and a pullback are a reminder that the market mood is still cautious. 76.50 is the first support and 72.30 the bulls’s last line of defence. A close above said resistance would send the price to the major ceiling at 82.20 which has capped the commodity’s multiple bounces. A bullish breakout would foreshadow a bullish reversal.

![Credit Card 160×600 [EN]](https://assets.iorbex.com/blog/wp-content/uploads/2023/06/13144507/Blog-Banner_EN-Banner_160X600X2.webp)