
As noted in our previous report last week, we warned that Gold and Silver are very close to sparking a correction to the downside, after few weeks of significant gains.
Gold and Silver posted a new high for this year, reaching the highest level since October of last year, and tested major resistance areas, which showed some selling pressure ahead of the weekend.
The retracement began by the end of last week and accelerated right after the results of the first round of the French election.
As the retracement is underway, we take a look at the key support areas, where buyers are likely to appear, and when could be the right time to start buying again.

Gold Nearing Its 200 DAY MA

Gold spiked all the way to 1295 last week, which is the highest level since November of last year. However, it failed to hold and eased back.
Gold eased back right from its medium-term downtrend line which lasted since June of last year, which should be watched very carefully over the coming weeks.
In the meantime, gold eased back to 1260’s, which should be a solid support as this is a previous top for gold back in February of this year.
The technical indicators have turned lower over the past few days due to the ongoing retracement. Yet, there is more room for further declines ahead.
There is a possibility to retest the 200 DAY MA which stands at 1253 where buyers are likely to appear. This is only if Gold failed to hold above 1260 support area.
Looking at Fibonacci Retracement levels, the 38.2% stands at 1256, while the 50% stands at 1245, with a confluence with 50 DAY MA. Those levels are also possible targets, before the upside trend resumes.
On the upside view, a break above the medium term down trend line is a priority for the rest of the year. If so, Gold would be ready to test 1300 and beyond.
Silver Failed At Former Resistance
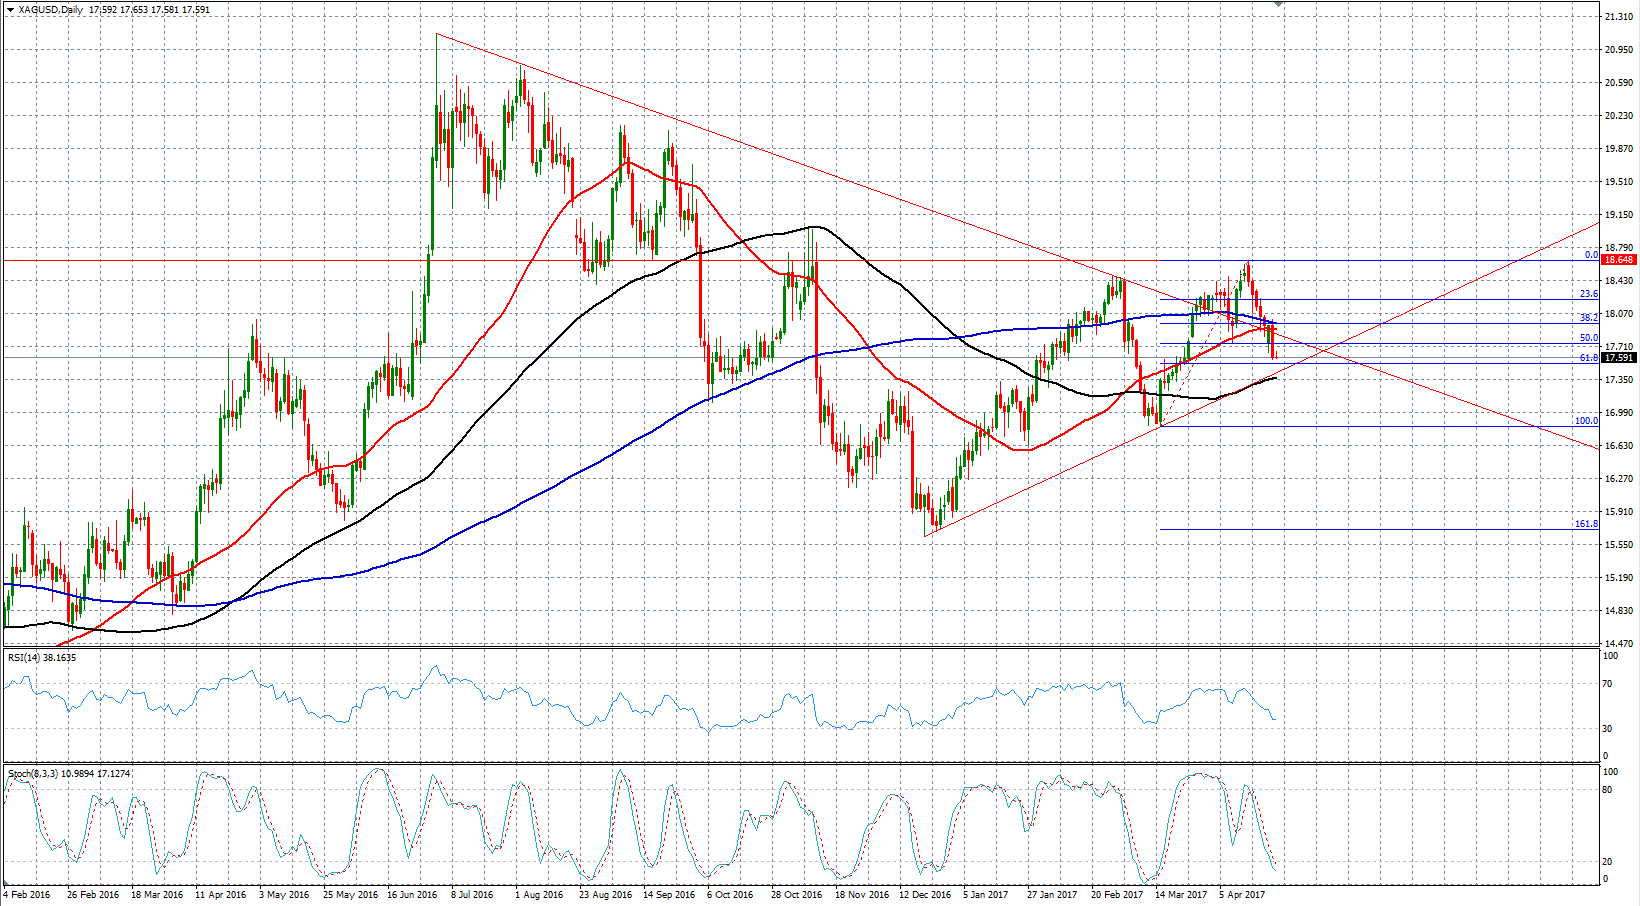
Silver managed to print a new year high last week around 18.64. Since then, it had been declining gradually back to 17.60 yesterday.
Silver also failed to hold above its key moving averages, including 200 and 50 DAY MA’s which seen as a sign of a deeper correction ahead.
Looking at the daily chart, the technical indicators are still far away from being oversold, but they are still pointing lower, which increases the chances for further declines ahead.
The first immediate support stands at 17.40, which represents its uptrend line for this year, which continued since November of last year.
At the same time, the 100 DAY MA stands at the same level of the trend line, where buyers are very likely to appear and defend the trend line and the moving average.
From Fibonacci Retracement point of view, silver has already retraced by around 55% from the recent rally. The 61.8% Fibonacci stands at 17.51.
In short, the area between 17.50’s and 17.40’s is very significant, as it will answer the question on whether Silver will resume its uptrend or that the uptrend is over.
On the upside view, if the support area held well and proved that the outlook remains bullish, silver needs to break and remain above the 50 and the 200 DAY MA to clear the way for further gains ahead.
Otherwise, the bullish outlook will be at risk to change back from bullish to neutral, until it can prove its strength to break above the mentioned moving averages.

