
In the wake of the US Jobs Report on Friday, safe haven assets showed a notable spike right after the NFP announcement.
Both Gold and Silver spiked this year’s highs. However, they both retreated at the end of the session, forming what could be a reversal signal, which might lead to a short-term retracement later this week.
Yet, the bullish outlook for the current year remains unchanged as long as both metals continue to trade above their key support areas for the year.
Gold Failed At 200 DAY MA

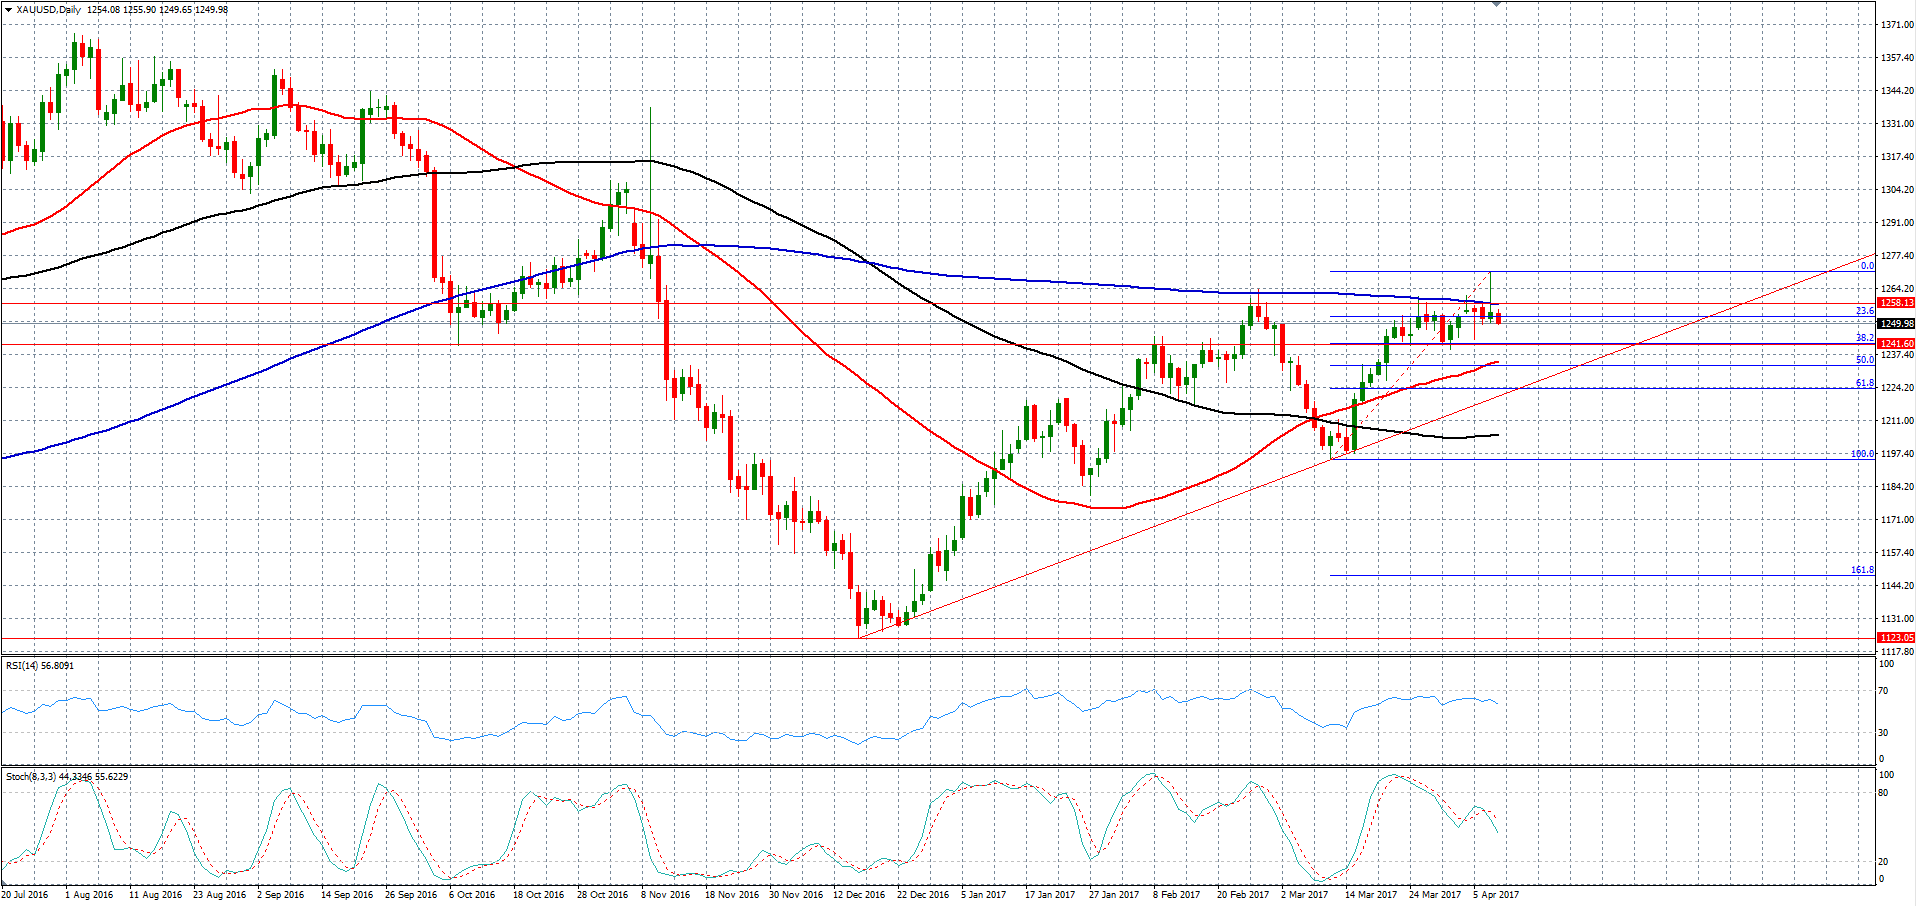
Gold prices managed to rise all the way above $1270 and posted a new high for this year at $1270.88 before it retreated back and closed last week’s trading below its 200 DAY MA.
This is not the first time Gold fails to break above such resistance; this is actually the second time this year. Yet, the medium bullish outlook remains, especially that the 50 DAY MA remains above the 100 DAY MA.
Moreover, the bullish outlook remains as long as the Gold stays above the previous dip in December of last year around $1123.
In the meantime, Friday’s close has led to two reversal signals on the daily and the weekly chart, which increases the possibility for a short-term retracement to downside ahead.
The first immediate support stands around $1241 which should be watched closely, as a breakthrough that support would accelerate the downside pressure back to its 50 DAY MA which stands at $1243 for now.
According to Fibonacci retracement, the 50% from the recent rally as shown on the chart equals the 50 DAY MA. Such confluence would increase the chances for a notable bounce from that area.
Otherwise, the retracement might continue all the way back to $1224, which represents its 61.8% Fibo, where buyers are likely to appear, where we will be looking for another bounce for a new year high above last week’s high.
The invalidation level for such outlook is a full week close below $1200.
Silver Nearing 50 DAY MA
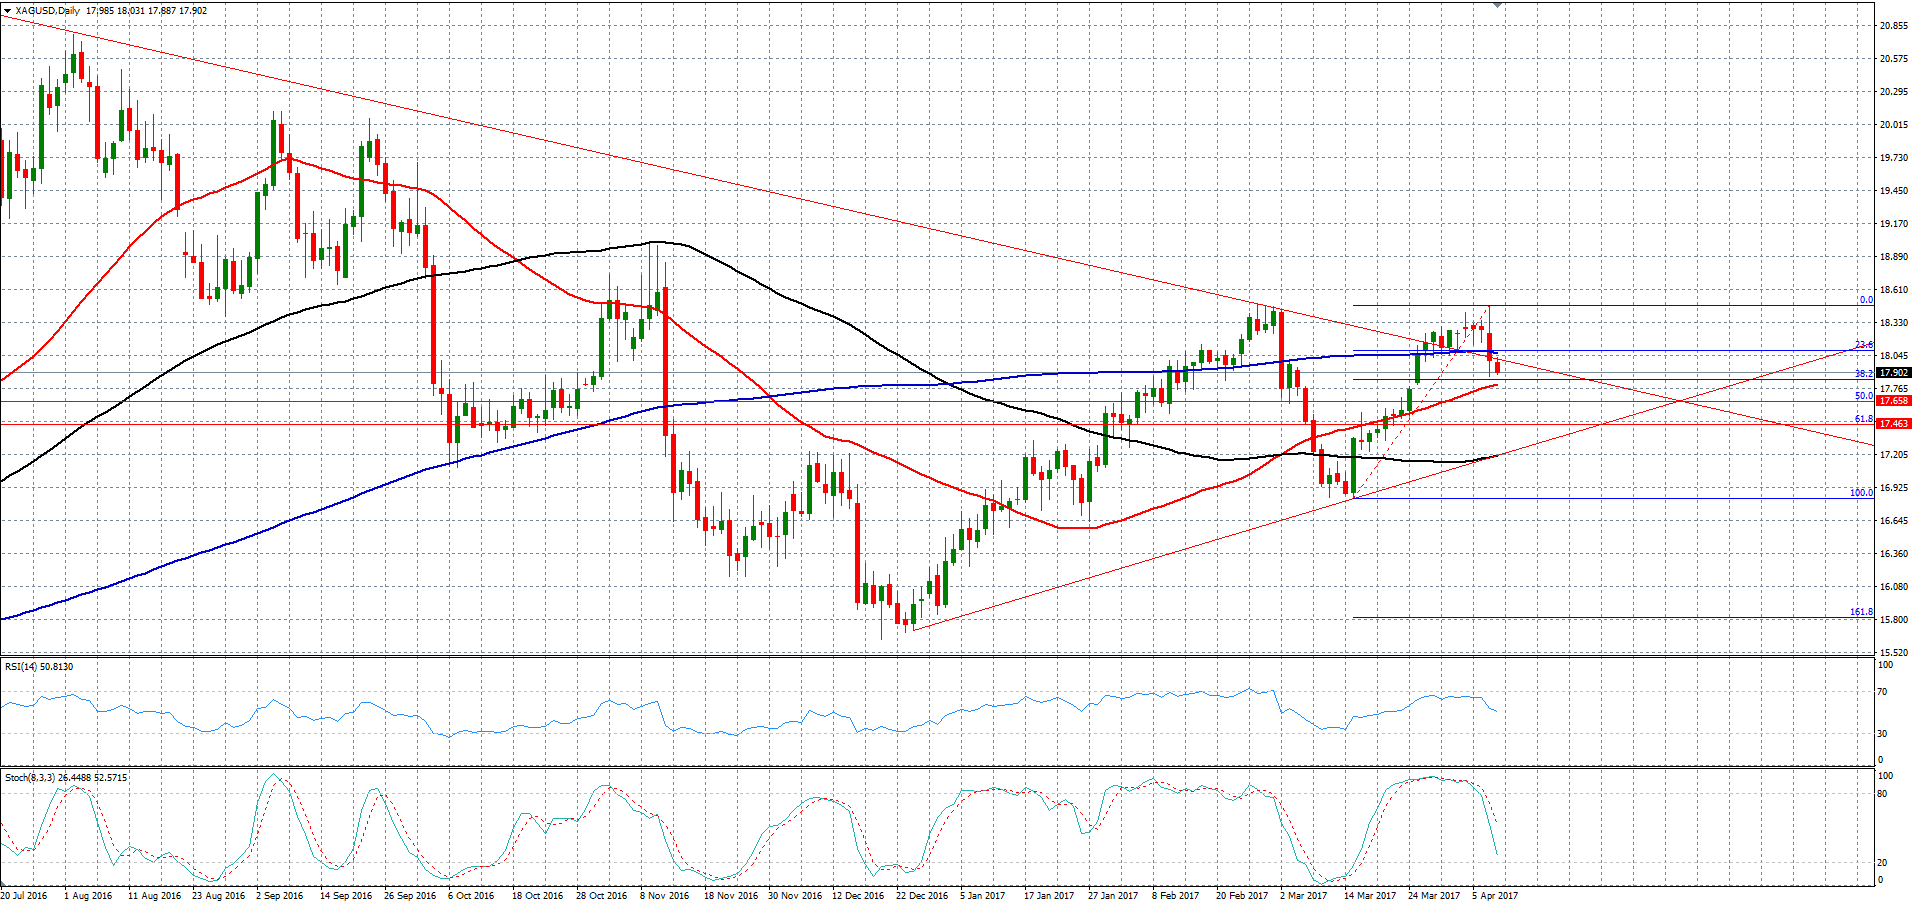
Silver has a slight difference compared to Gold. Last week silver was able to stabilize above its short term downtrend line for the entire week. However, Friday’s figures have led to a jump and dump move, leading to a decline back below the 200 DAY MA and the broken trend line.
Such move means that last week’s breakout is considered as a fake breakout. Yet, it doesn’t change this year’s bullish outlook as well.
A short term retracement is now in place, but likely to be limited before the upside trend resumes.
The first immediate support stands at 17.80 which represents its 50 DAY MA, while a breakthrough that support would clear the way for a deeper retracement.
The 50% and the 61.8% Fibo retracement ratios would be the next possible retracement targets at 17.65 and 17.46 respectively where buyers are likely to appear.
A notable bounce should be seen around that area. If not, this would be another sign for a deeper retracement which should not surpass 17.20, which represents its 100 DAY MA and its short-term uptrend line on the daily chart, as a break through that support would change this year’s outlook from bullish to neutral.

