The US Dollar Index remains within our projected plan since almost two weeks, with attempts to break above the key resistance which stands at 101.80 to 102.0.
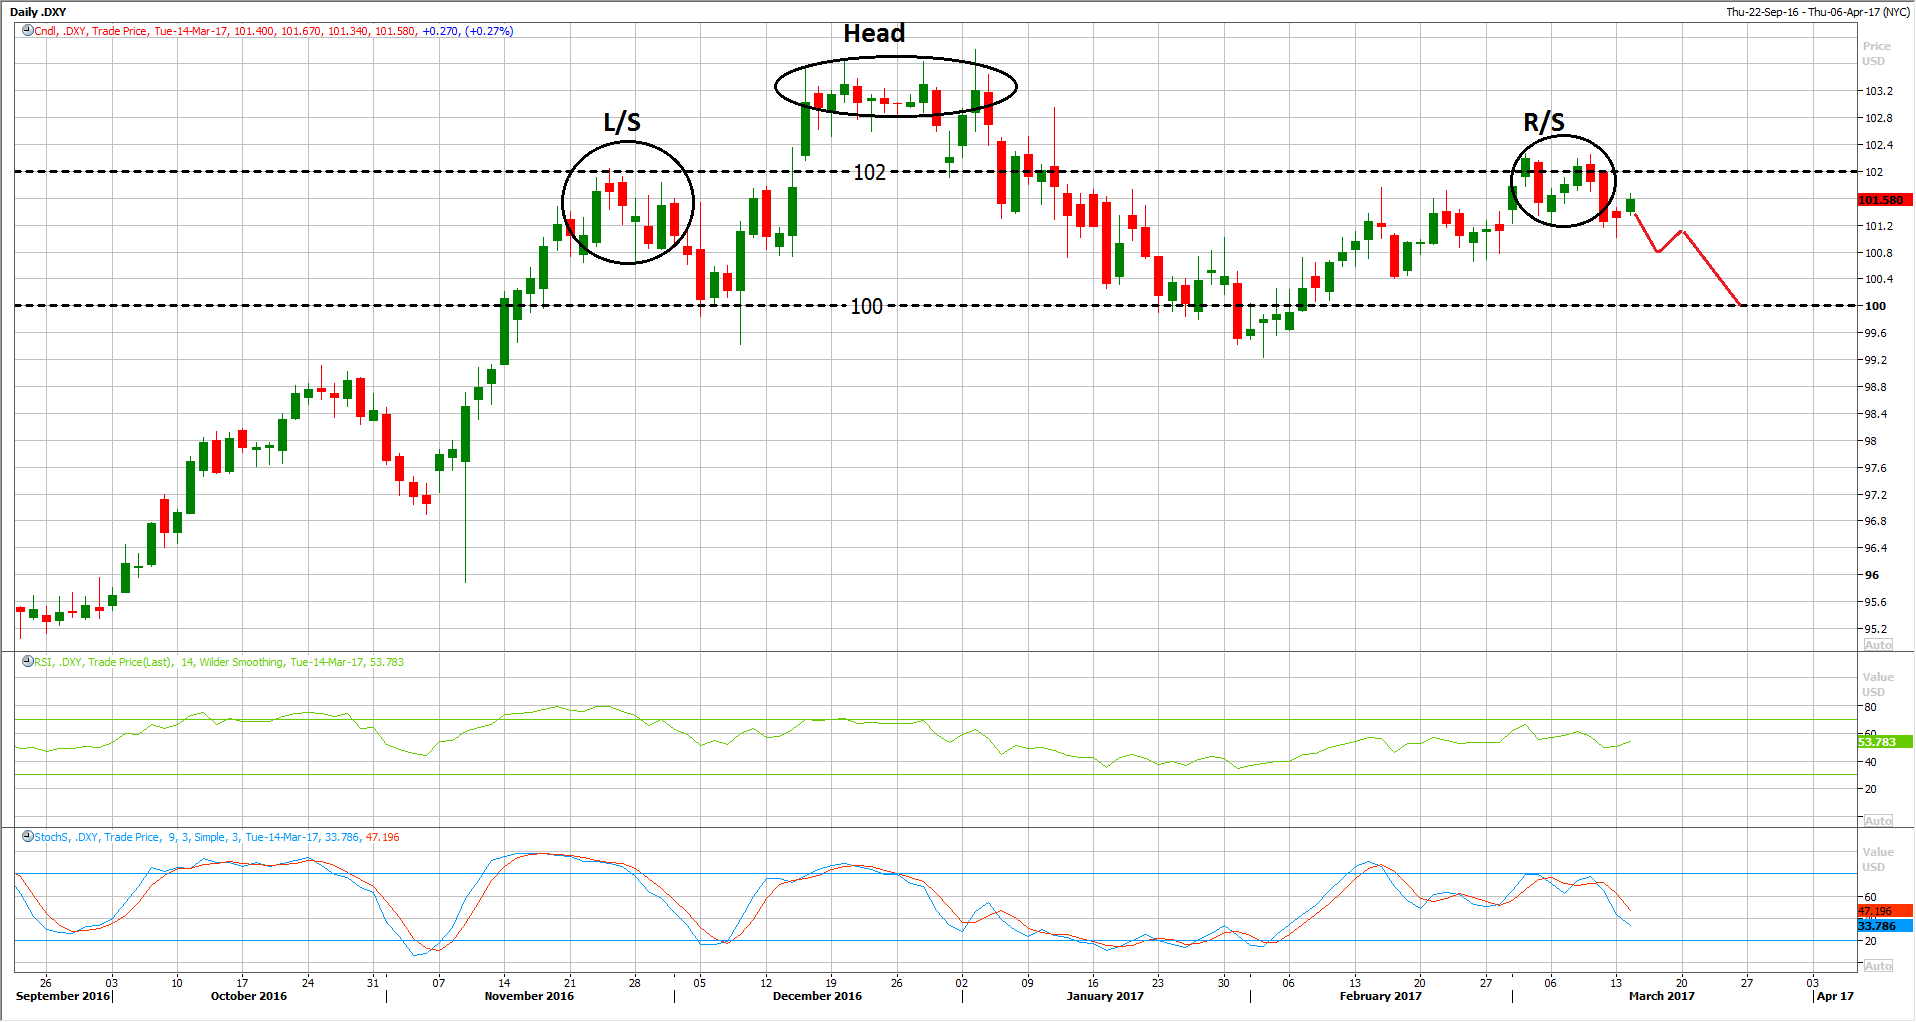
Last week the US Jobs Report was actually the catalyst for the survival of the bearish pattern, which is the head and shoulders on the daily chart as shown in the image below.
However, more catalysts are still needed to clear the way for another leg lower and to confirm the bearish pattern.
The Federal Reserve Catalyst?

The Federal Reserve might be the right and the most important catalyst of this potential pattern. Some would say that raising rates means a stronger currency.
This is true, but again, the market has already priced in such move. The market will always price in such decision in advance.
The Fed Fund Futures spiked to 100% (chance to raise rates) since more than two weeks, which led the US Dollar index to rebound recently from its 100 barrier all the way to 102.0.
Dovish Hike
This is what most likely scenario, the Federal Reserve might raise the rates by 25bps. However, the Fed will always try to cap USD gains as much as possible, as rising USD is hurting growth, inflation and its against the new administration’s plans
Therefore, the Federal Reserve might need to show some dovish remarks and actions. This can be done by cutting growth and inflation estimates when they publish the economic projections today.
This would be enough for the market to understand that March’s rate hike might be the last one for the first half of this year. In return, USD buyers are likely to disappear.
Head And Shoulder Pattern
The Head and Shoulders formation is still in progress, and there is no guarantee that this formation might be completed. Yet, this is what the current fundamentals and technical analysis are suggesting.
The left shoulder stands at 101.80, while the Head stands at last year’s high at 103.40, and now we are still waiting for the second shoulder to develop which is also stands between 101.80 and 102.0.
As long as the US Dollar Index continues to trade below these levels, the pattern is likely to be more clearer over the next few days.
A weekly close above 102.0 at any time would be the invalidation signal for such pattern. Last week, the index traded more than two days above that resistance, but Friday’s jobs report was the actual catalyst for a close below that resistance again.
Therefore, don’t judge the pattern by a daily close, it’s always better to wait until the weekly close for confirmation.
Today’s Data
In the next few hours, we will be focusing on some inflation figures from the US, including PPI and Core PPI, which set to have a limited impact on the markets, as liquidity is still lower as everyone waits for the Fed’s decision.
The estimates are softer in February compared to January’s figures. The MoM PPI is set to rise by 0.1% in February compared to 0.1% in January, which would be the weakest increase in four months.
As for the Core PPI, estimates are also softer in February with 0.2% compared to January’s 0.4% increase, which would be the weakest increase in two months as well.
Final Note
Despite the fact that we believe that the US Dollar is building a bearish pattern on the daily chart, traders should be aware that the British Pound might be the only currency that may suffer against the dollar.
This is due to the long waited Article 50 trigger. Rumors are hovering around that the UK PM Theresa May might trigger the Article 50 as early as Thursday. Therefore, GBP might be one of the biggest losers on that day, even if the US Dollar Index kept on declining further.

