
Crude Oil managed to recover from June’s lows all the way to today’s high, supported by some OPEC and Non-OPEC members remarks, in addition to some inventories data.
Despite all the talk about the production cut deal, there is something not right here, and it looks like there is someone is cheating, whether from OPEC or Non-OPEC members.
OPEC total production increased for the past two months, in May and June, reaching the highest level since December of last year at 32.7M barrels.
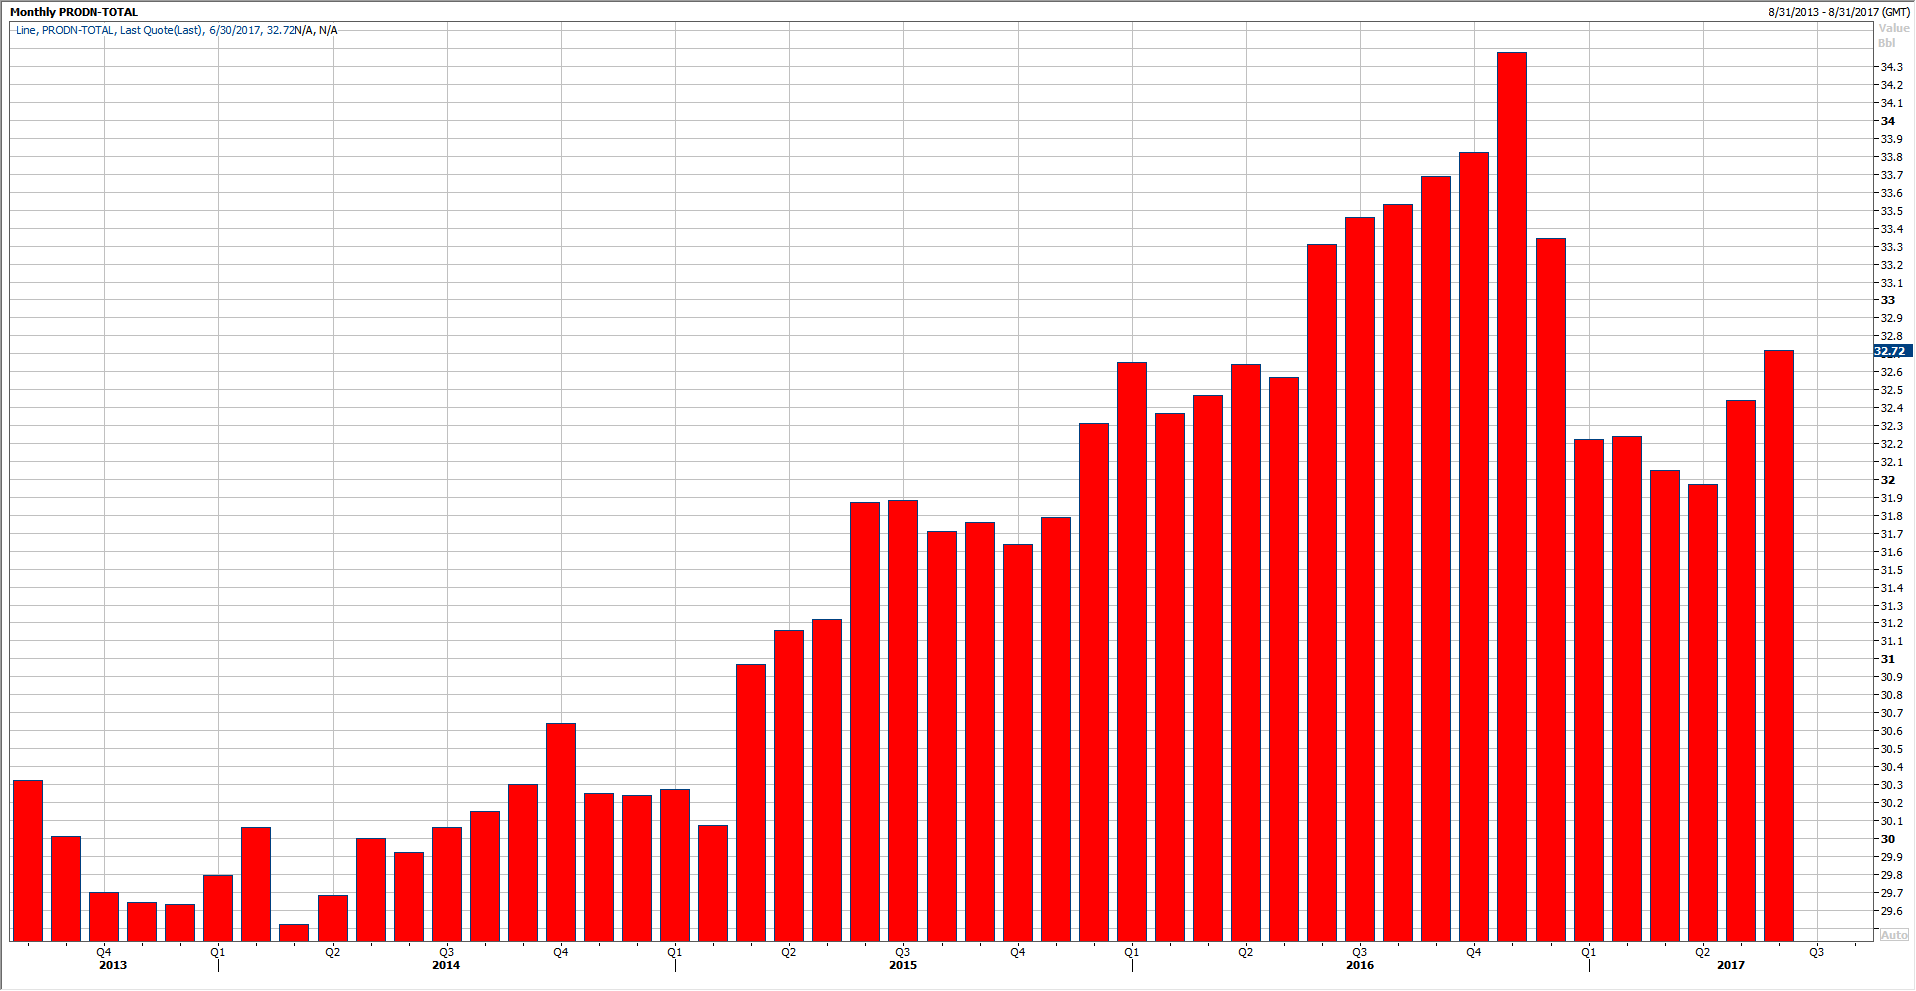

Moreover, earlier this morning, Petro Logistics announced that OPEC July oil supply is set to rise 145K barrels per day compared to June’s data, which means that July’s OPEC production will exceed 33M barrels.
This would be the third monthly increase in a row, one we have not seen since Q3 of last year.
The question is how come the production is increasing while OPEC and Non-OPEC members agreed to cut the production and to extend the deal until March of next year? The answer is simple, whether there is no deal, or someone is cheating.
Crude Tumbles After Petro Logistics Report
Brent and WTI Crude were about to break out earlier this morning. Brent was very close to break above $50, while WTI Crude was trading near the 47.50’s. Optimism was all over the place.
Unfortunately, Petro Logistics report ruined the party for both Crudes. Brent tumbled by more than 1.5%, trading below 48.60’s until this report is released, while WTI loses more than 1.7% trading around $46.
US Crude Oil Inventories
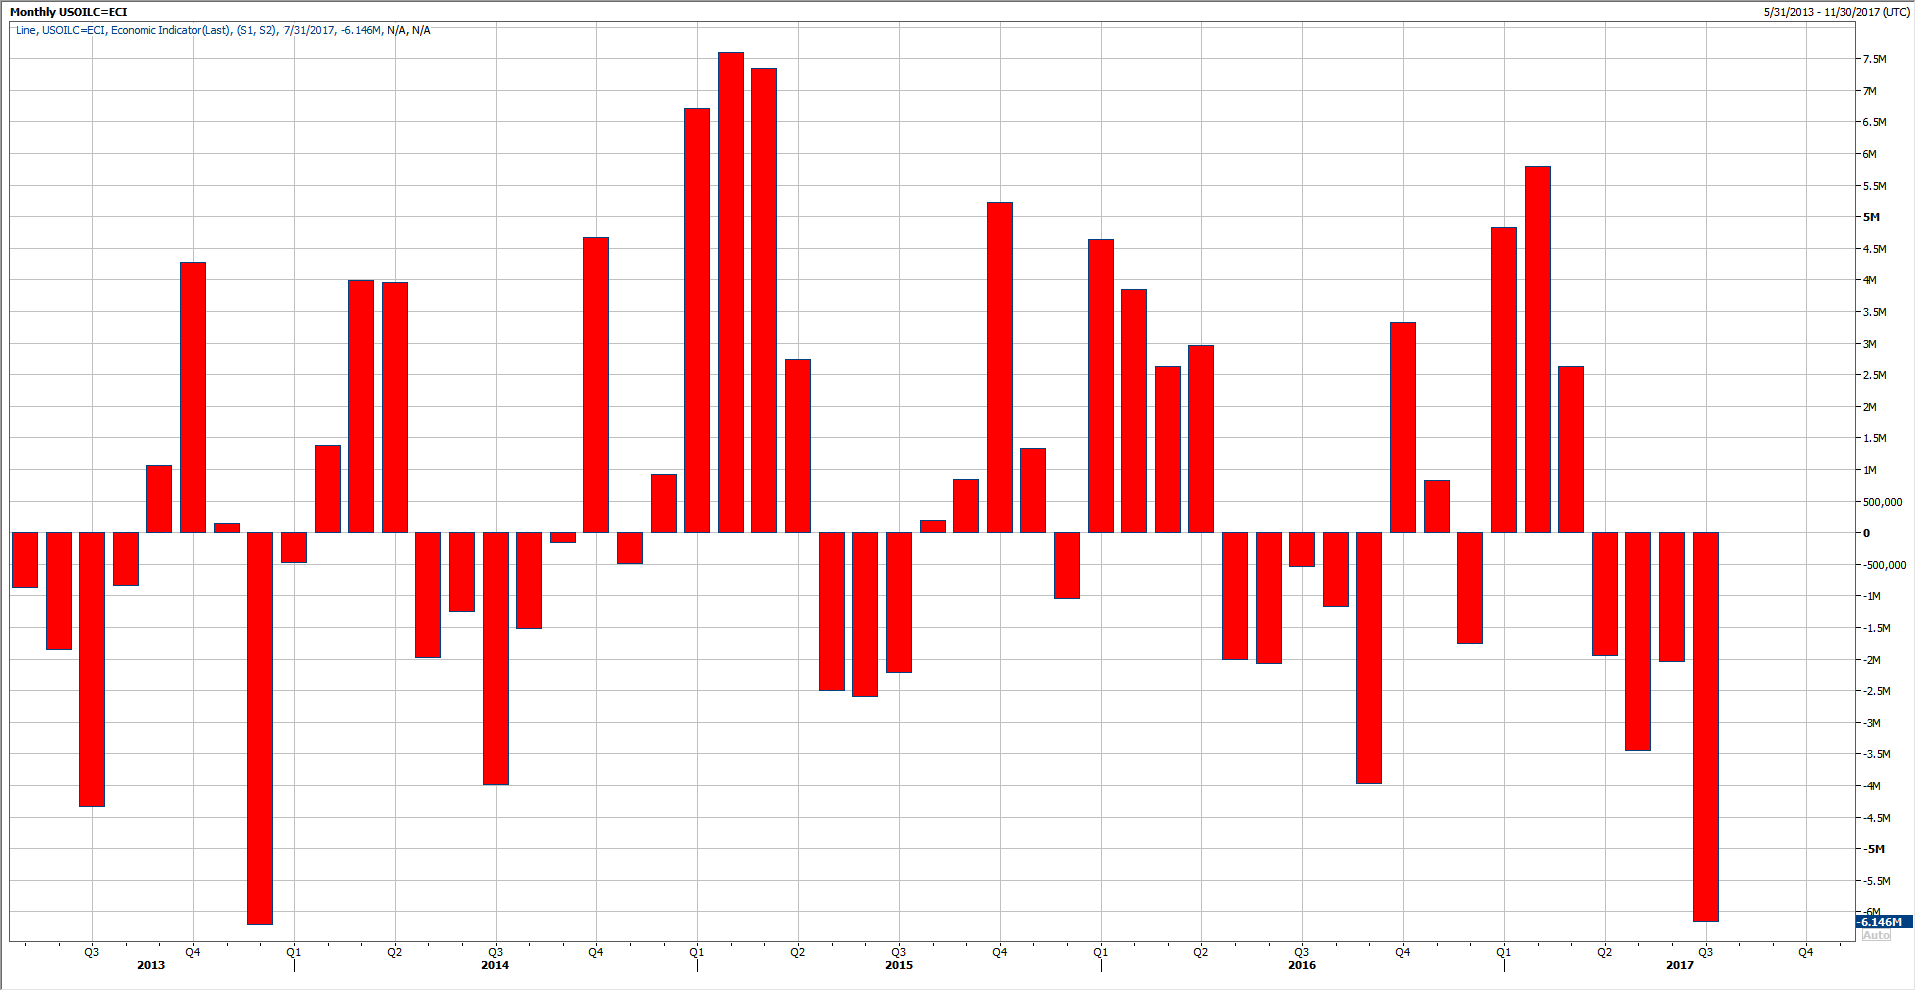
The US Crude Oil Inventories is still showing some consistent declines. For the past three weeks, the inventories posted three weekly declines in a row. One we have not seen since May of this year.
Moreover, if we look at the Monthly chart of the US inventories, we can see that the total decline in inventories from the beginning of July until today is the biggest decline since December of 2013.
Of course, we have to wait until the end of the month to confirm the net if the inventories, but so far, despite the decline in inventories, Crude Oil is still sluggish.
Where Do We Go From Here
Since the beginning of the year, Brent Crude and WTI formed a clear lower highs pattern on the daily char.
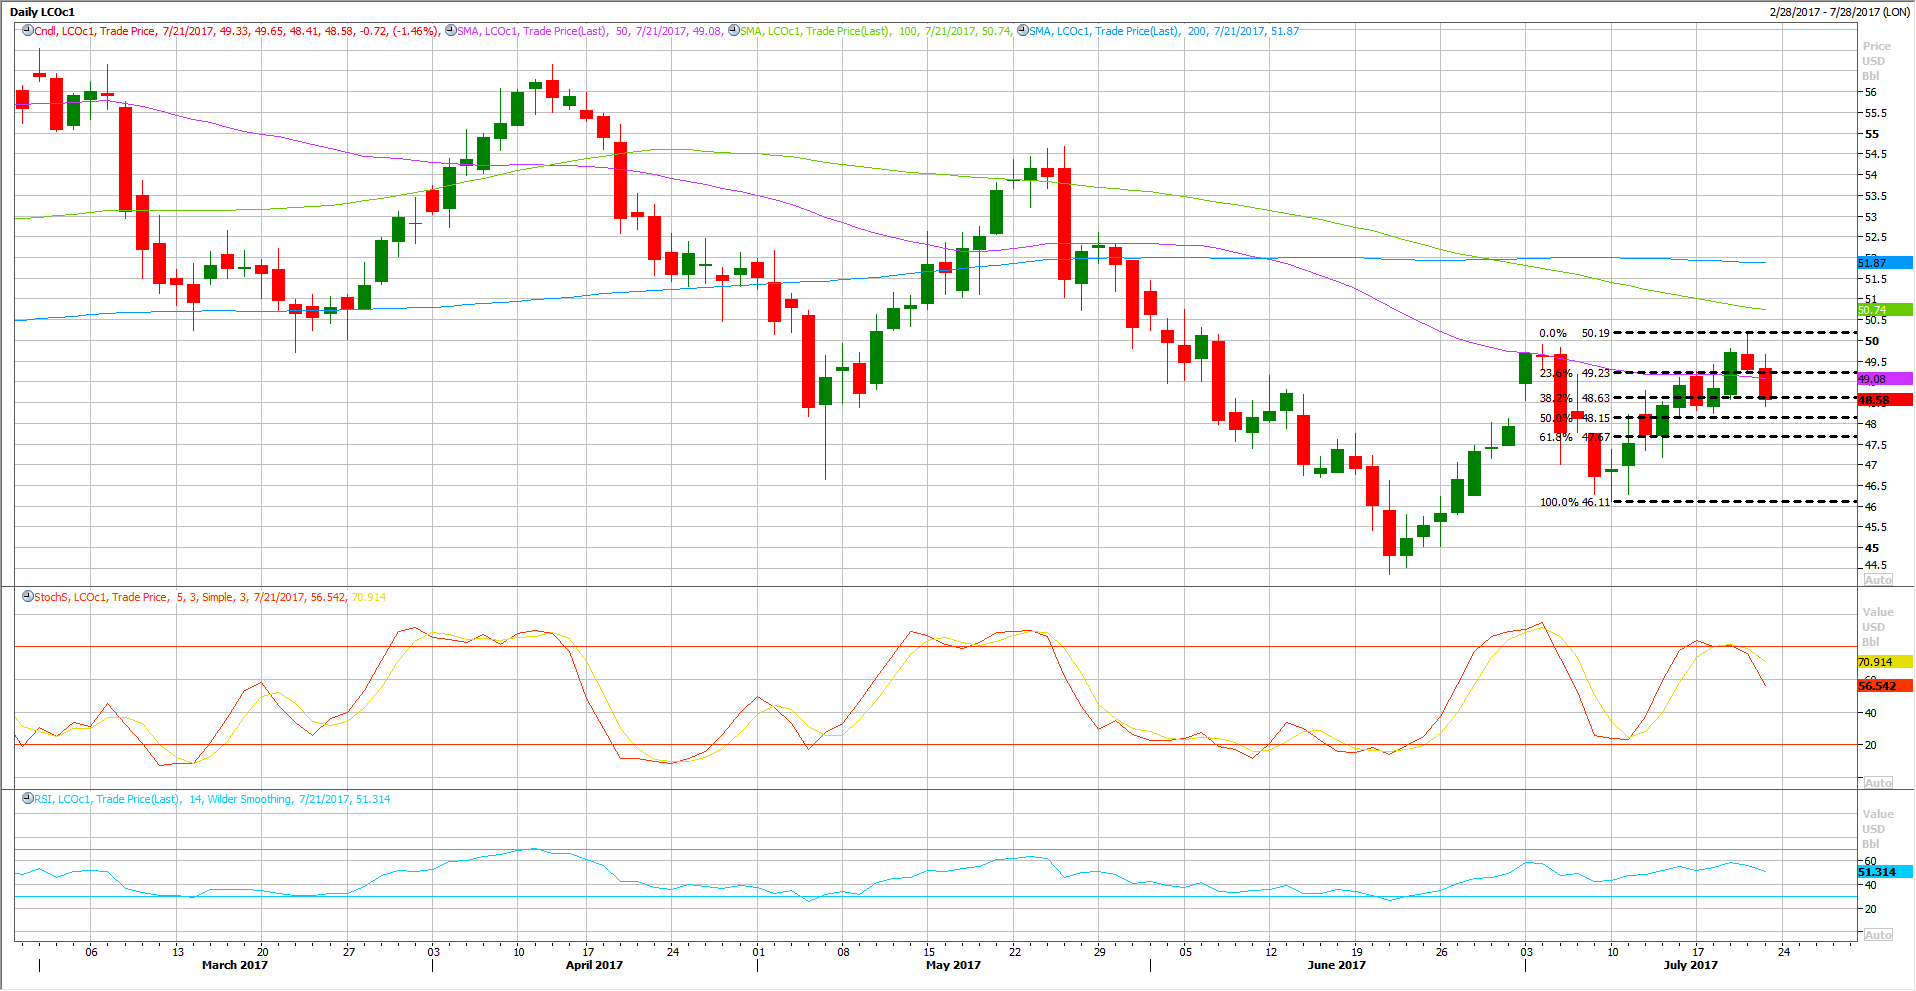
Looking at Brent’s daily chart, some would say that Brent broke the pattern yesterday, when it spiked above $50 for a limited time because yesterday’s high is above the previous top that was formed at the beginning of July.
Yet, there is still a double top formation on the daily chart after today’s decline, so we can still keep the bearish outlook unchanged.
Meanwhile, the next immediate support stands at 48.20, which represents its 50% followed by 47.70’s which is the 61.8% Fibo retracement of the recent rally as shown on the chart, which should be watched carefully, as a breakthrough those levels would clear the way for further declines ahead.
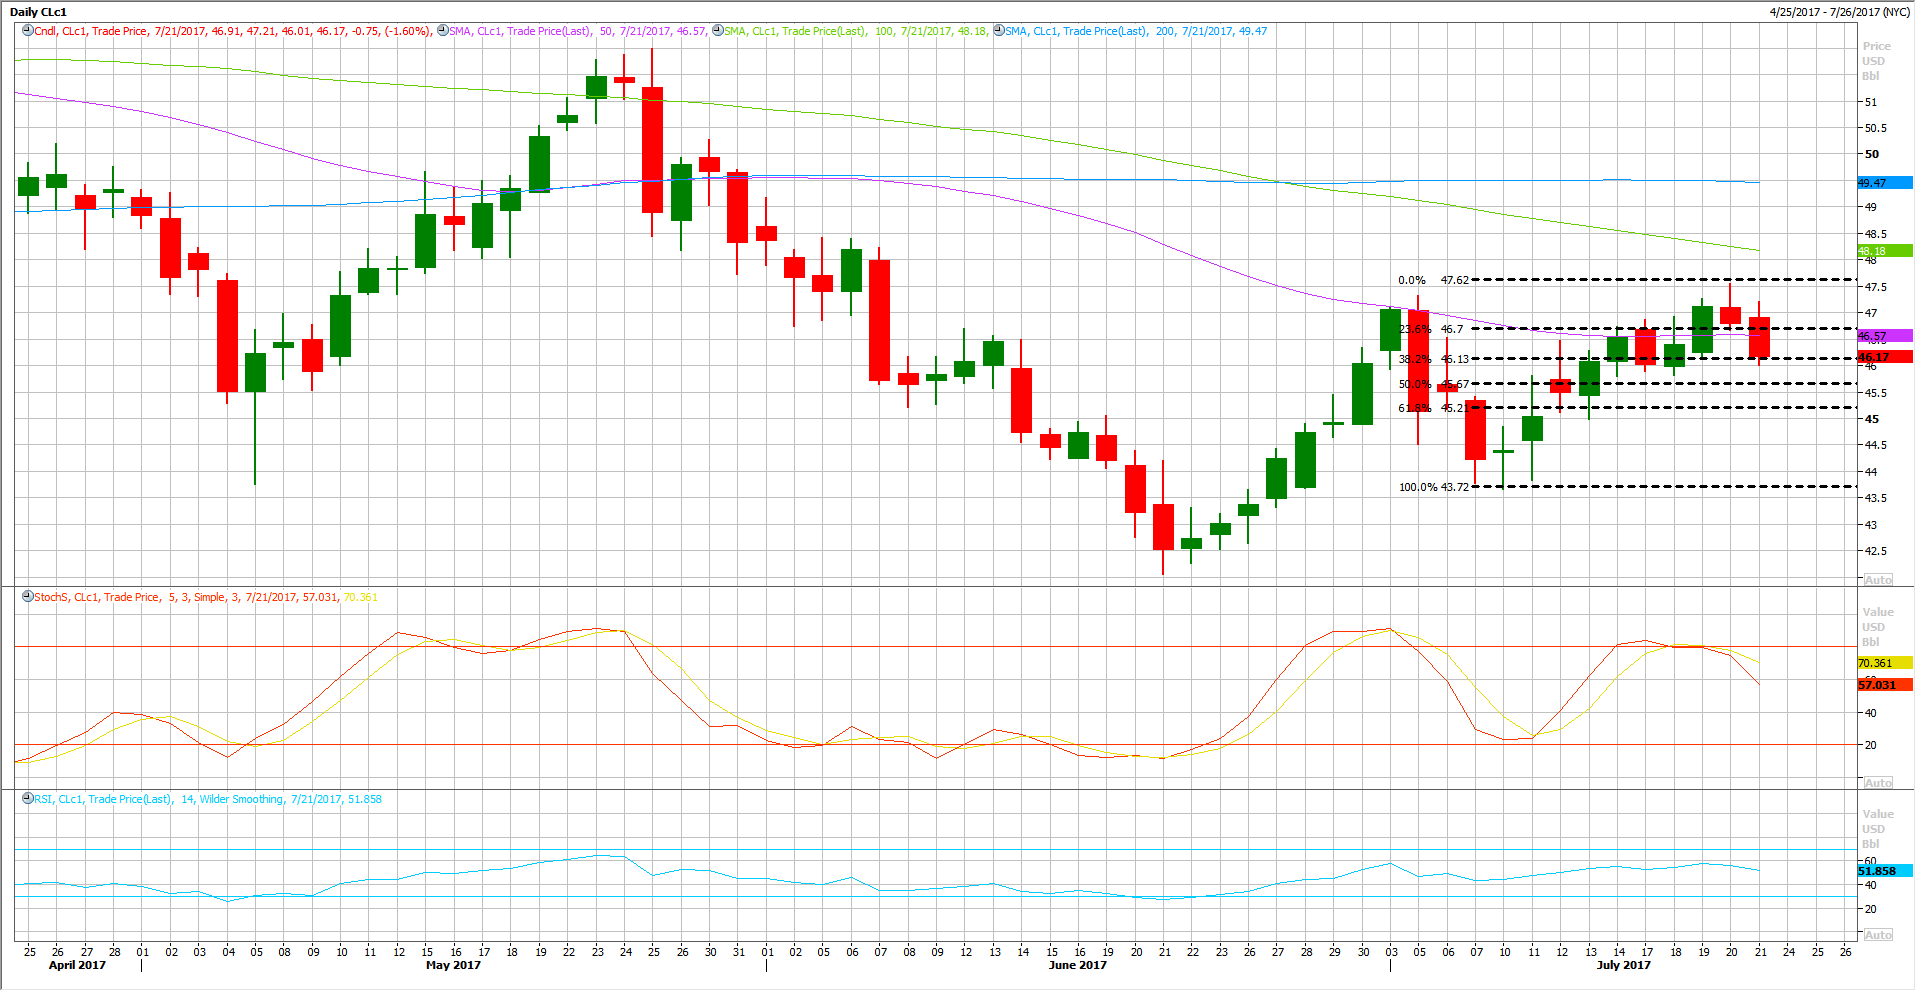
WTI has the same exact story. Yesterday, WTI broke the rules of the lower highs pattern on the daily chart. However, it also managed to for a double top, which also keeps the bearish outlook unchanged.
The next immediate support stands at 45.67 followed by 45.21, which represents its 50% and 61.8% Fibo retracement as shown on the chart, in addition to the $45 psychological support.
A breakthrough these levels would accelerate the downside pressure, possibly toward $43.70’s.
Technical Indicators are still far away from being oversold, and they just crossed over to the downside, which supports the current bearish view.

