

GBP USD tests key support
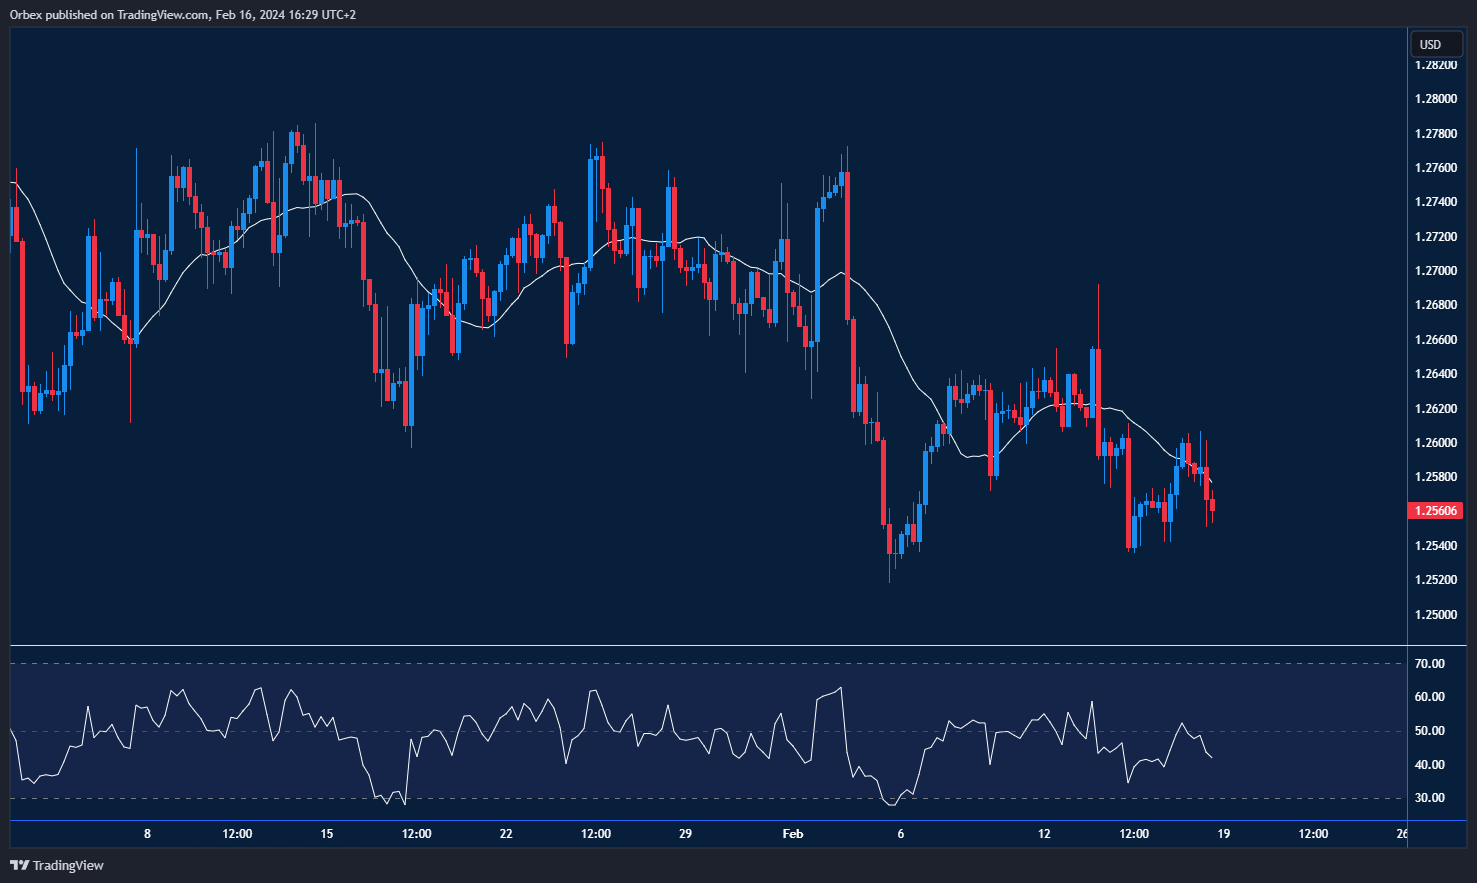
Cable saw another downturn on the books as recession fears weighed heavy on the pound. On the chart, the pair is still hanging around February’s low at the mid-1.25 range. Should a recovery begin, the previous swing high of 1.2650 is a key level for bulls to target. A bearish breakout below 1.25 could trigger a new sell-off to the critical floor at 1.2455. As the RSI bounces back into neutral territory, 1.2590 is the first resistance.
USDCHF keeps swinging higher
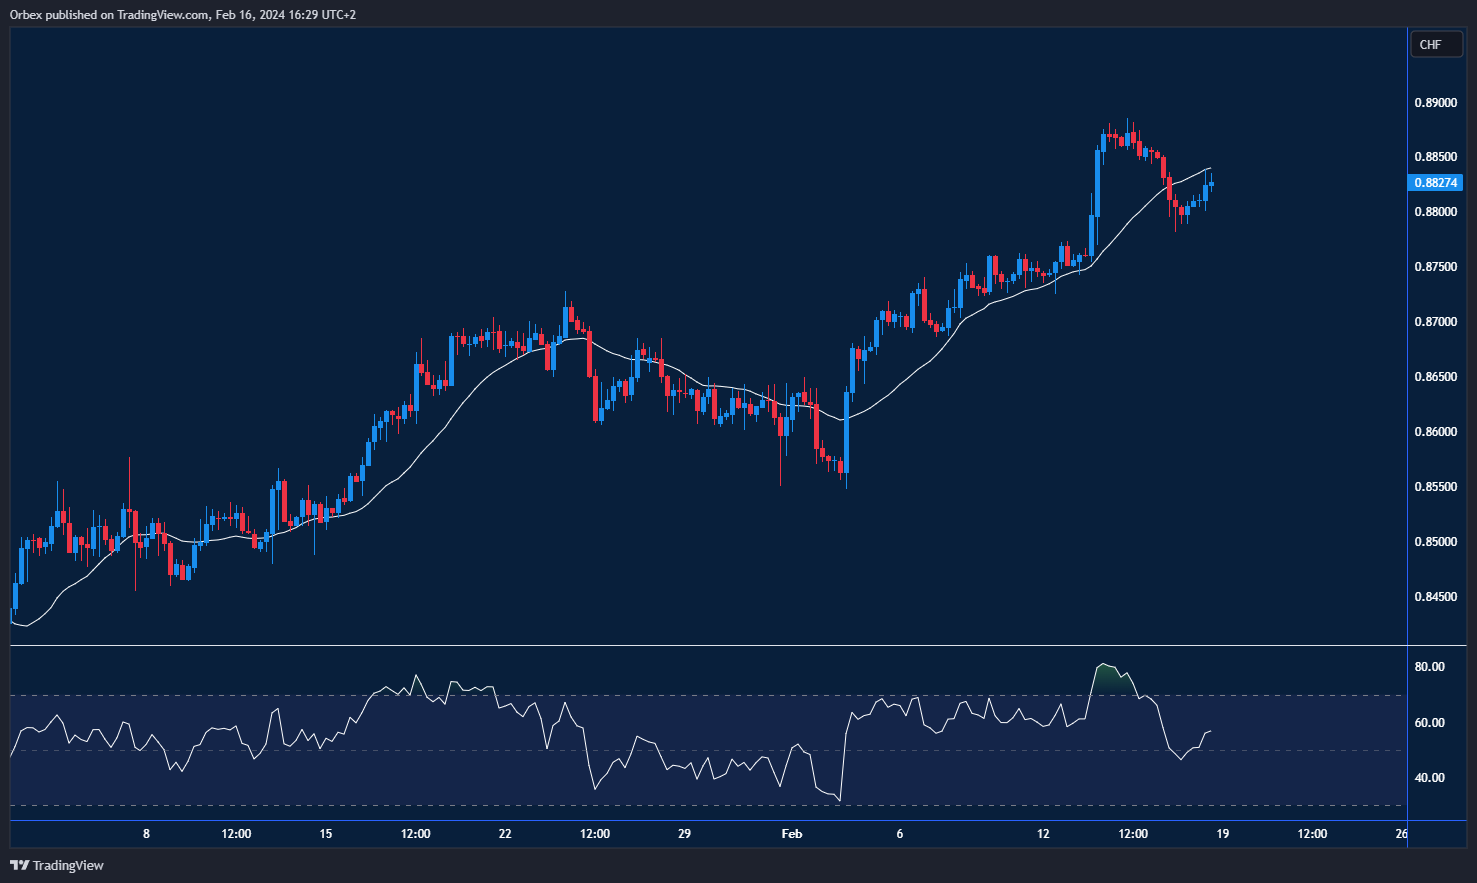
The US dollar prepares for another wave higher, even though poor retail sales threatened a decline. Buying pressure had eased after the pair tentatively broke above 0.8800 level. The subsequent fallback saw a drop at the former resistance near 0.8870. However, the buy side remains in the game as a recent bounce of 50 pips looks to test the previous high. With the RSI falling from overbought territory, a bearish divergence could hamper the revival, with 0.8785 being the first support.
USOIL hits resistance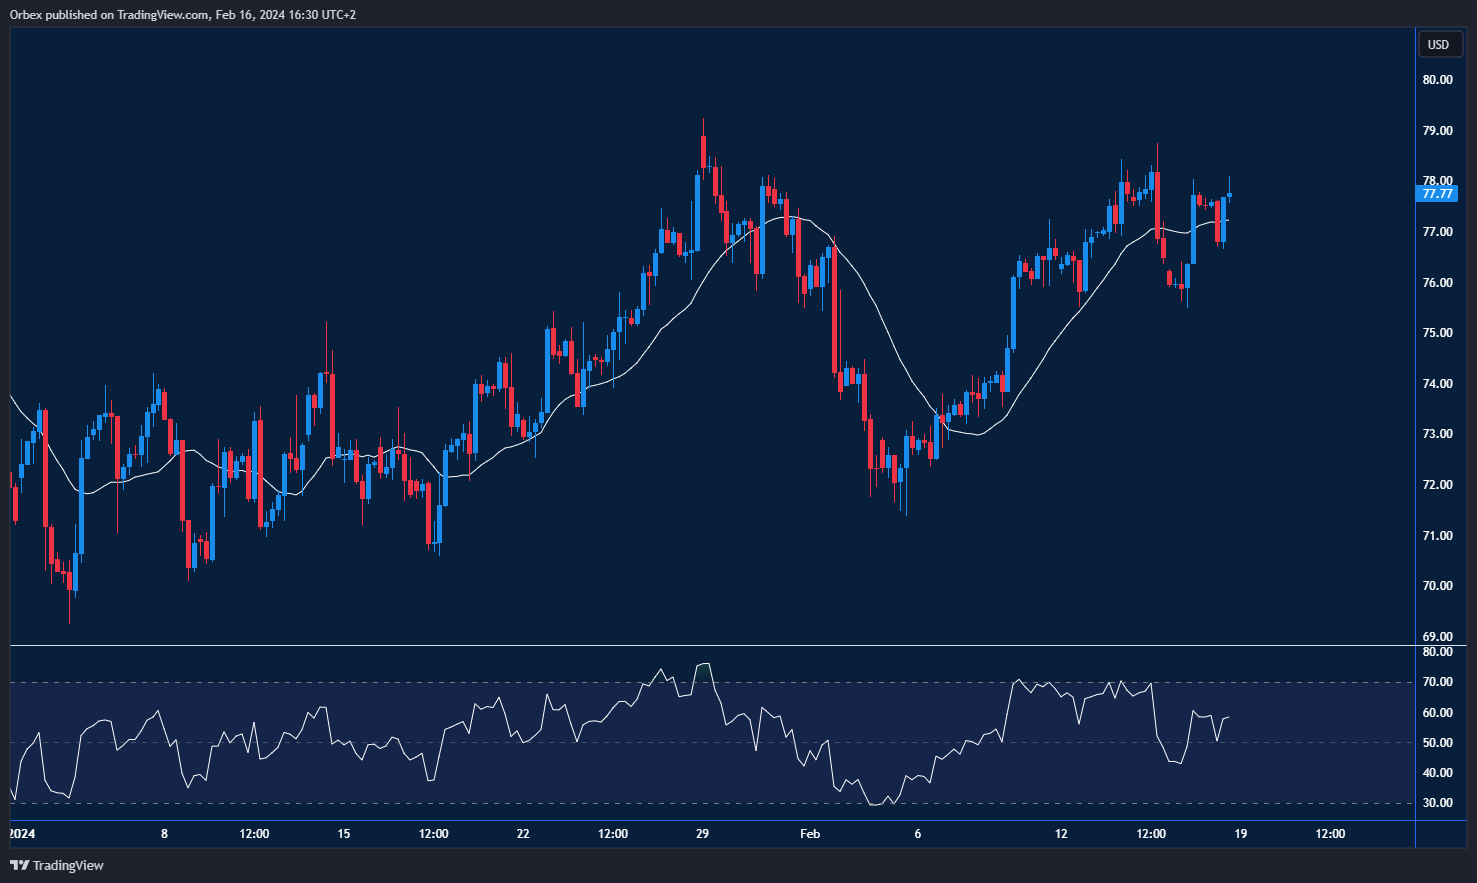
WTI crude struggles after another buildup in US inventory. Price action is still in a recovery mode following the late January sell-off. The choppy grind around 78.00 resistance and a pullback remind sentiment is still cautious. 76.50 is the first support, and 73.40 is the bulls’ last line of defence. A close above the said resistance would send prices to 78.65, which has capped the commodity’s multiple bounces.
Test your forex trading strategy with Orbex