
EURUSD goes into correction
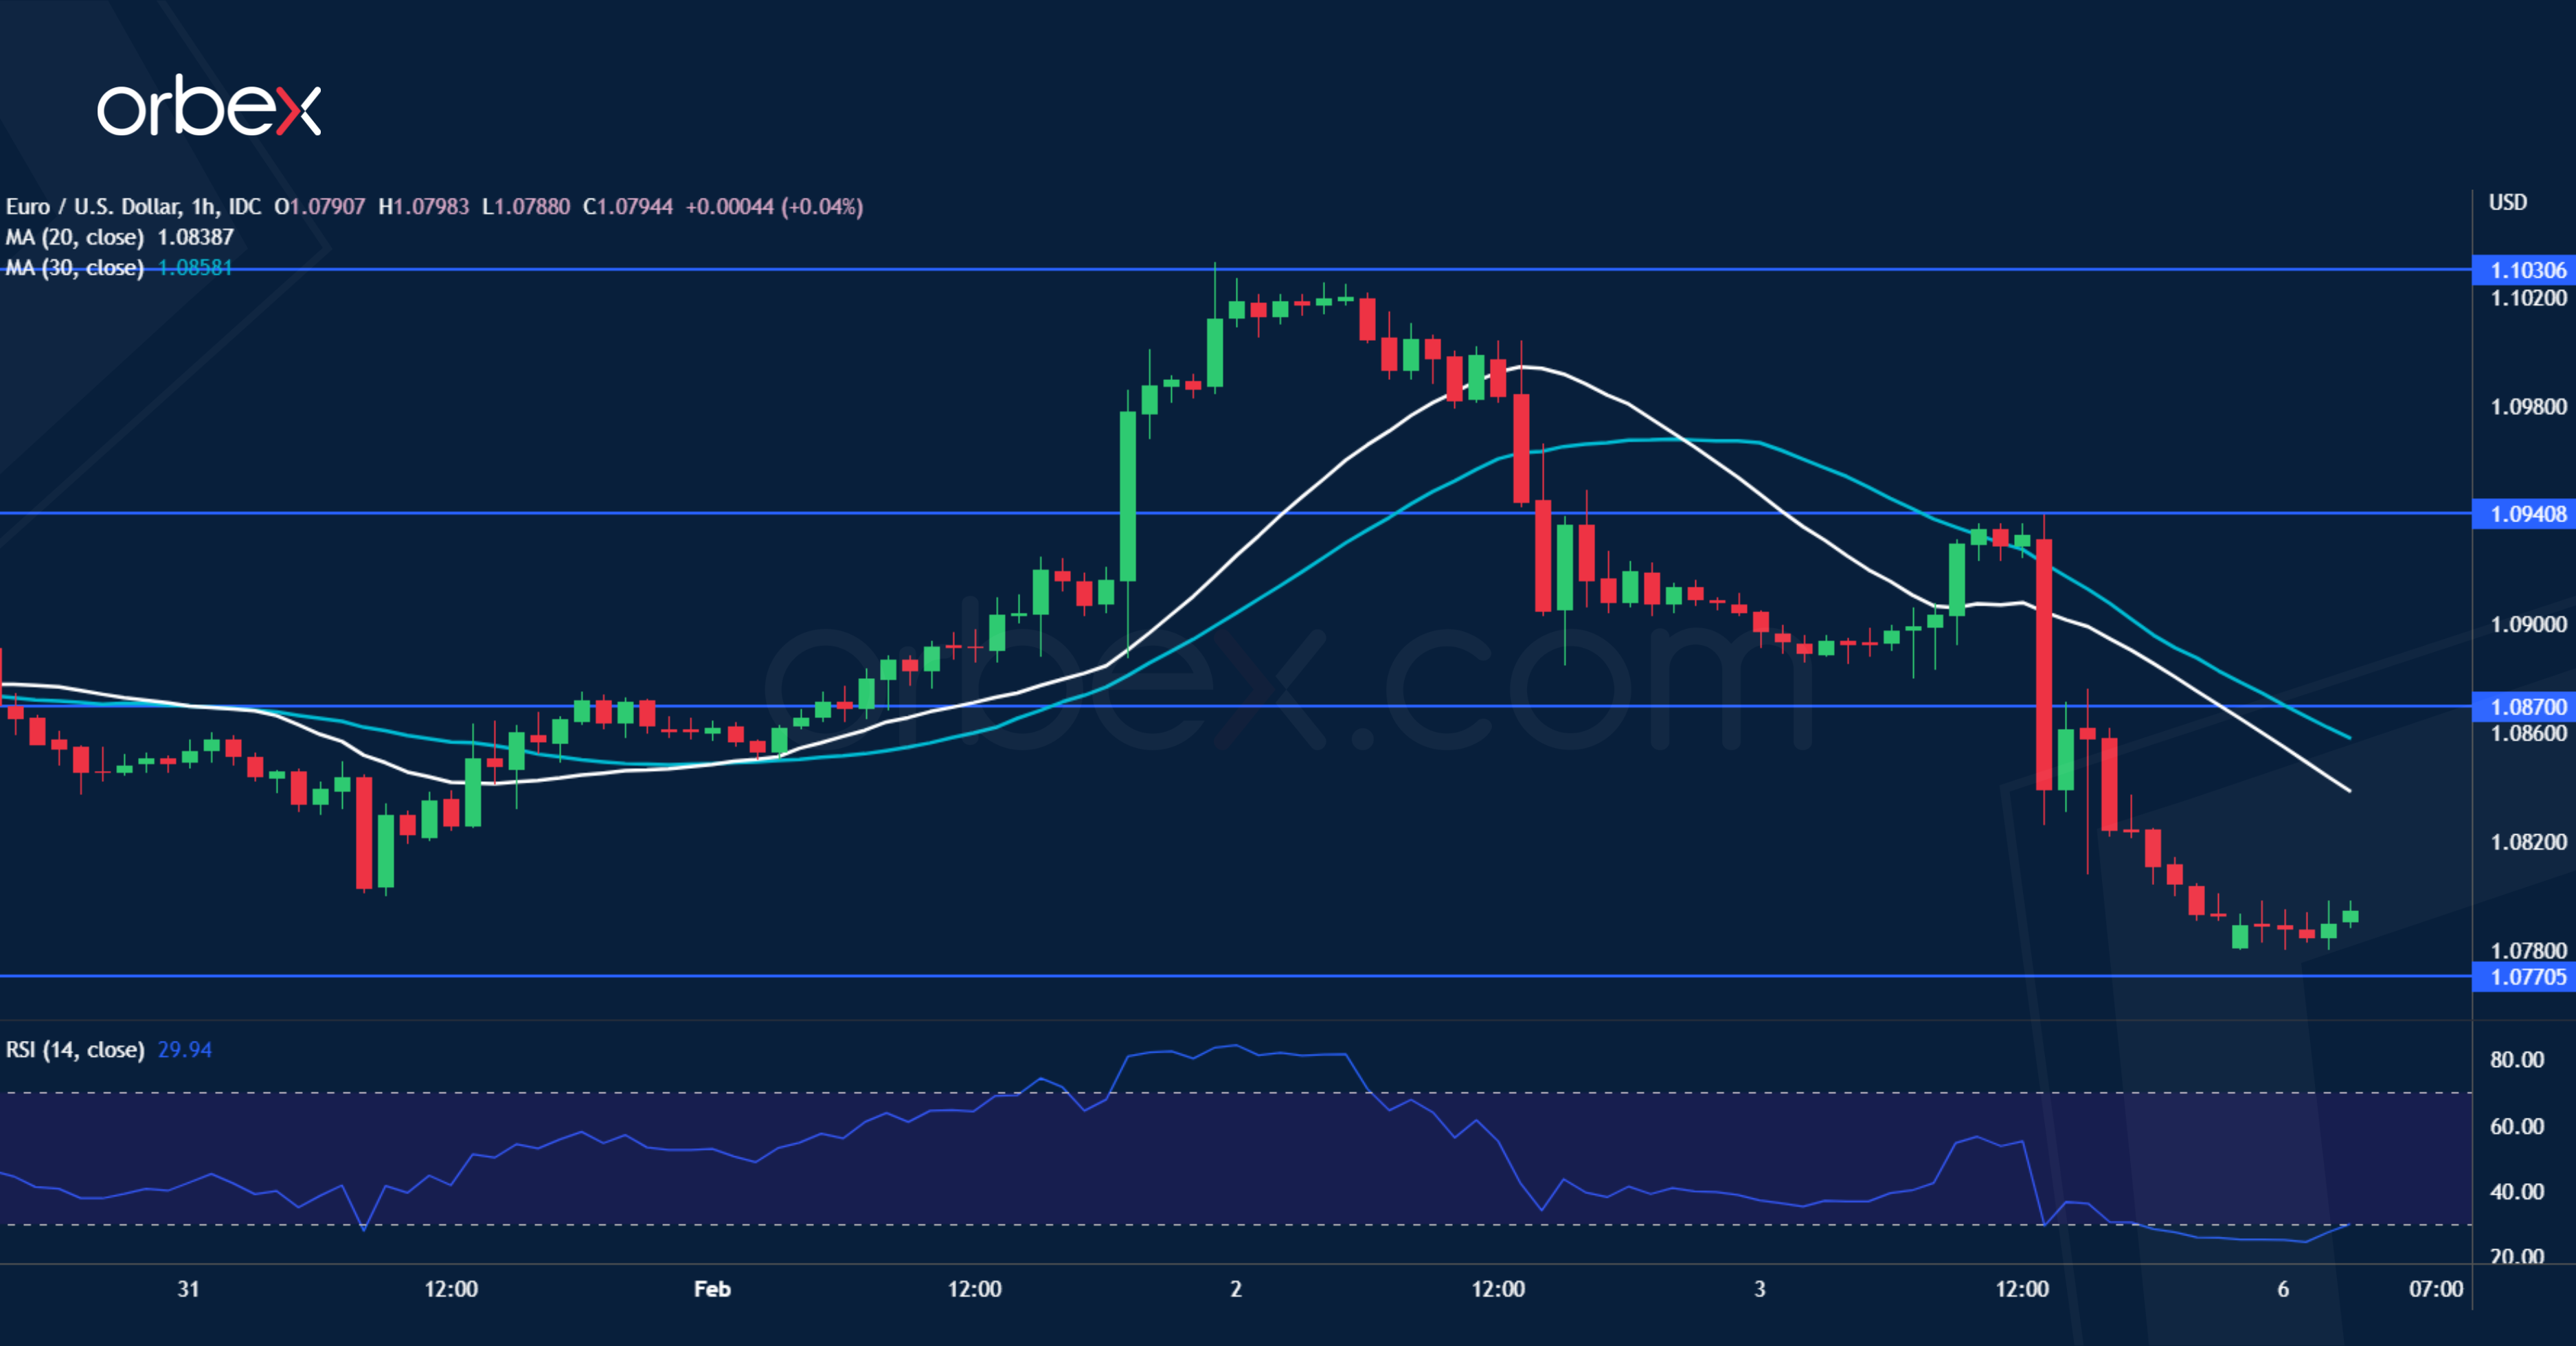
The US dollar soared after January’s jobs report far exceeded estimates. The pair came to a halt in the supply zone around 1.1000 from last April’s sell-off. A drop below the bullish engulfing candle at 1.0890 was already a sign of weakness with the euro struggling to hold on to recent gains. A sharp fall below 1.0850 (20-day SMA) and 1.0800 indicates that the bulls have bailed out. 1.0770 on the 30-day SMA is the next level to see whether the price would stabilise, and 1.0870 is a fresh resistance in case of a bounce.
XAGUSD seeks floor

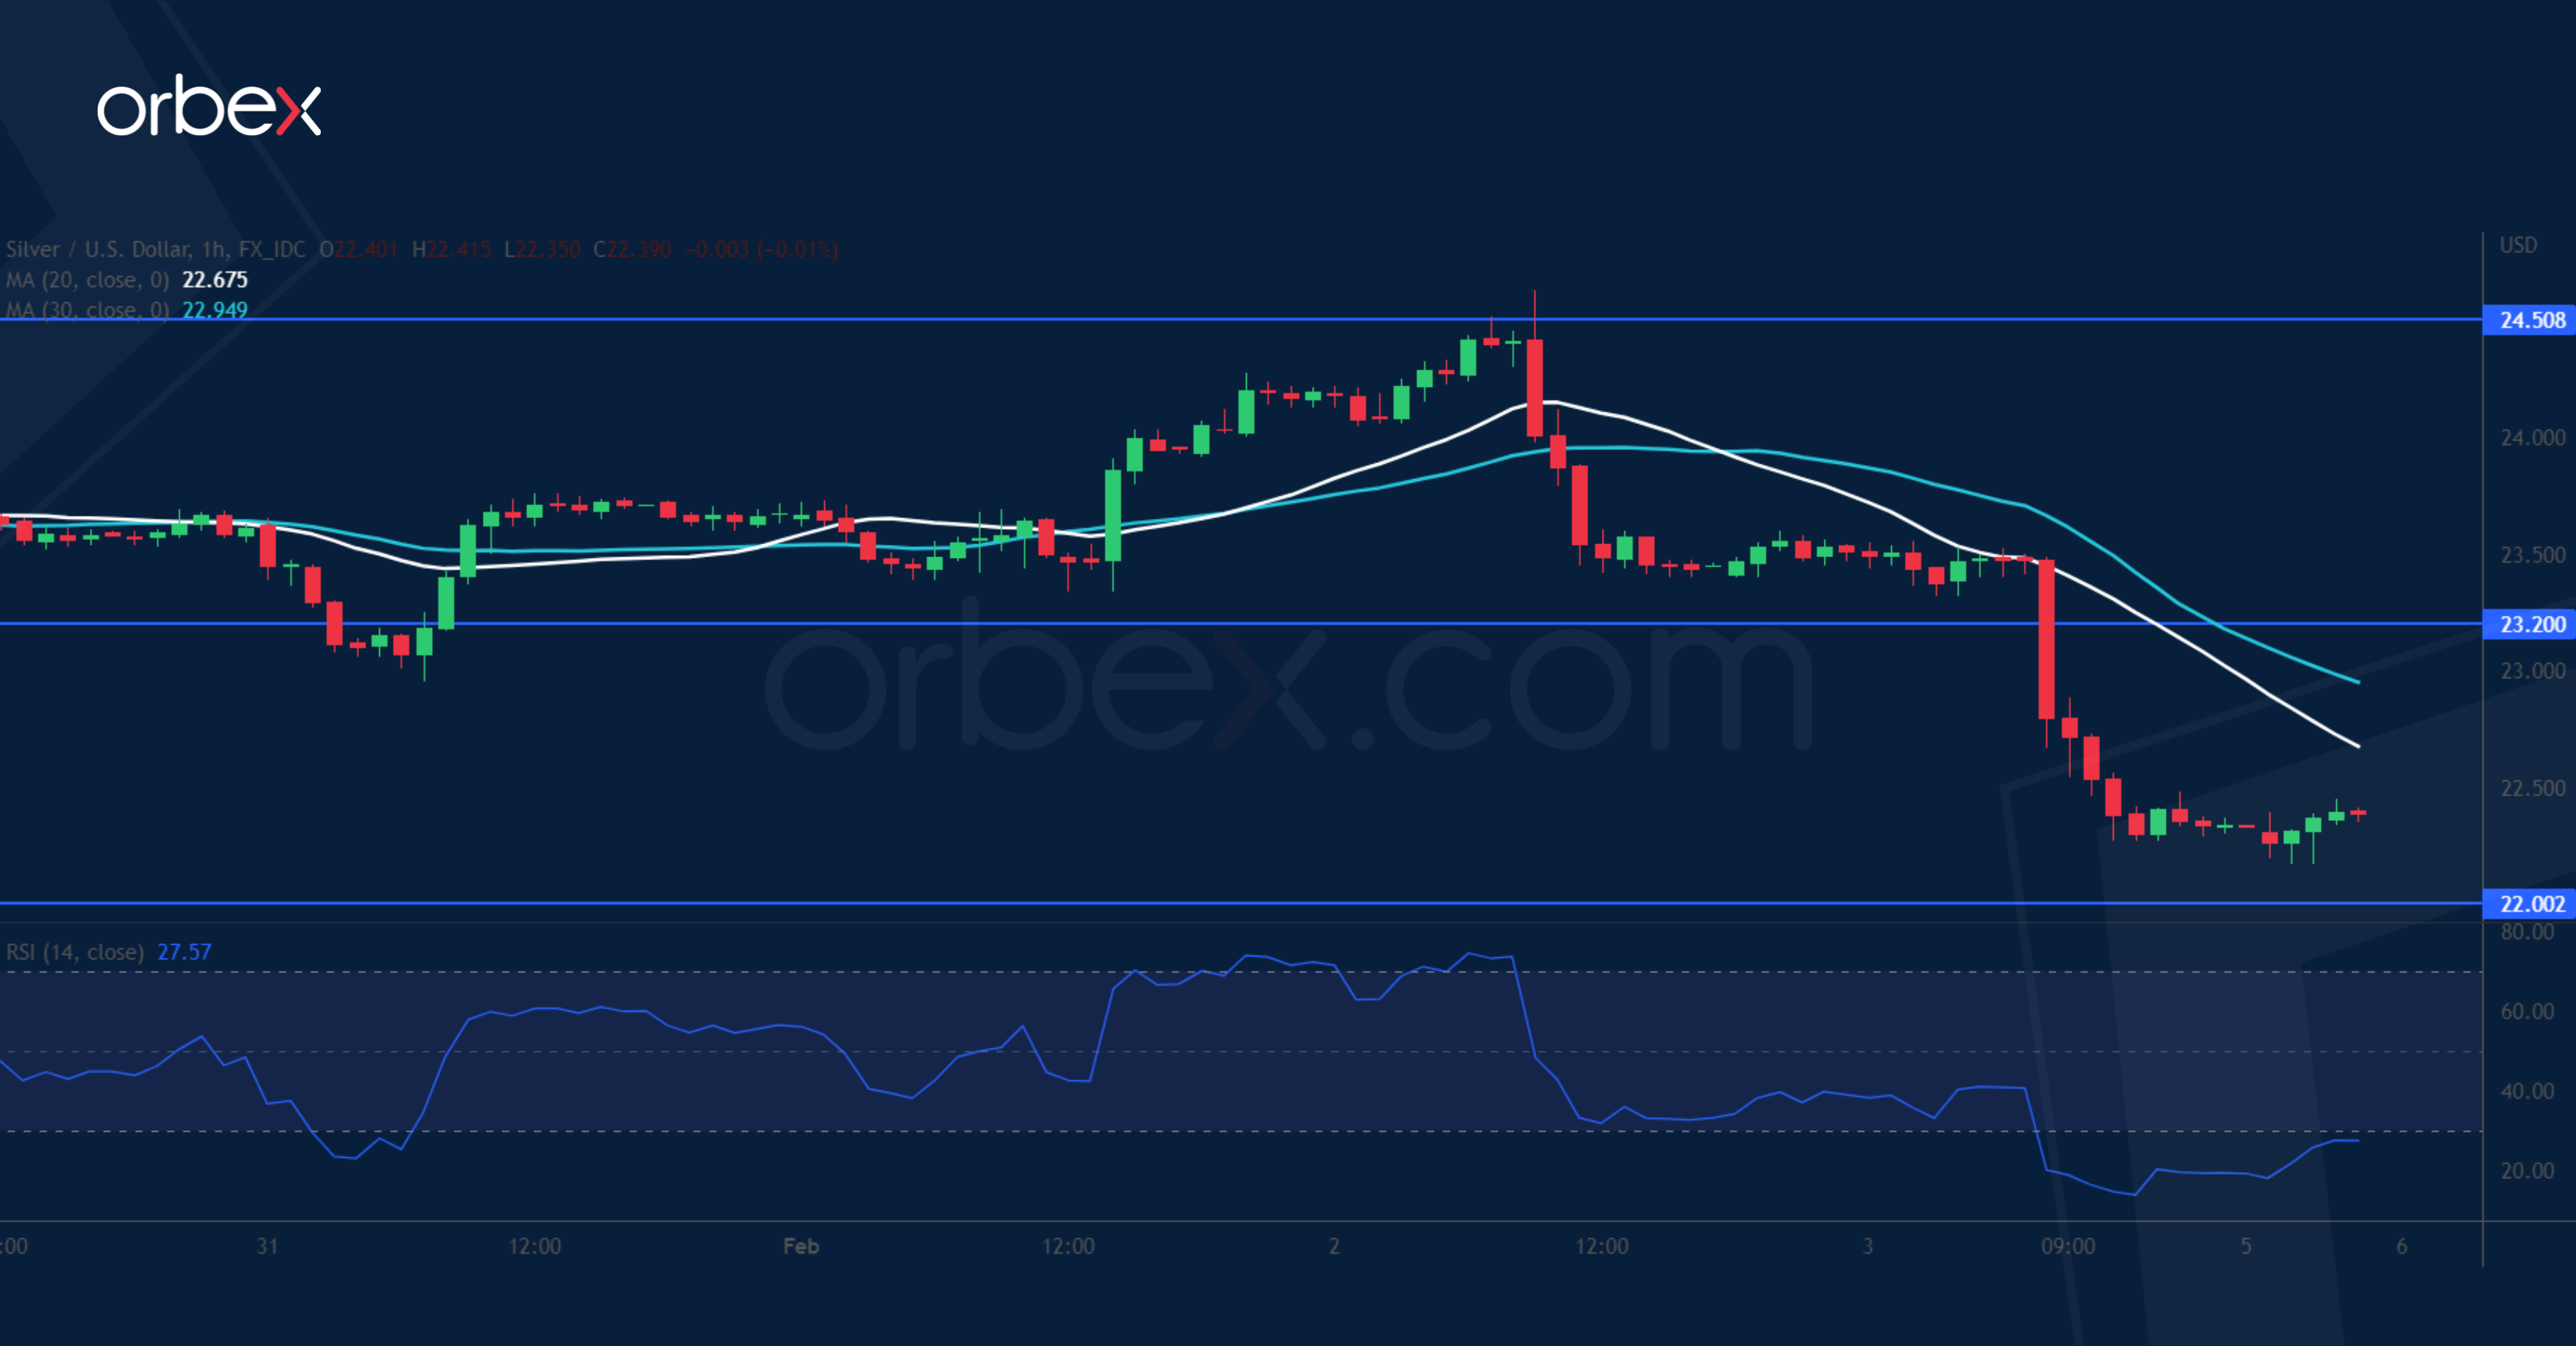
Silver plunges as Treasury yields and the US dollar leap forward post-NFP. The metal was struggling to sustain its momentum in the major supply zone around 24.50 despite another tentative breakout. The lengthy choppy action at the top was a sign of indecision and a fall below 23.40 prompted the bulls to exit. The liquidation below the critical floor at 23.00 suggests that the path of least resistance has turned south. The round number 22.00 is next to see if buying interest would show up with 23.20 as the first hurdle.
GER 40 consolidates gains
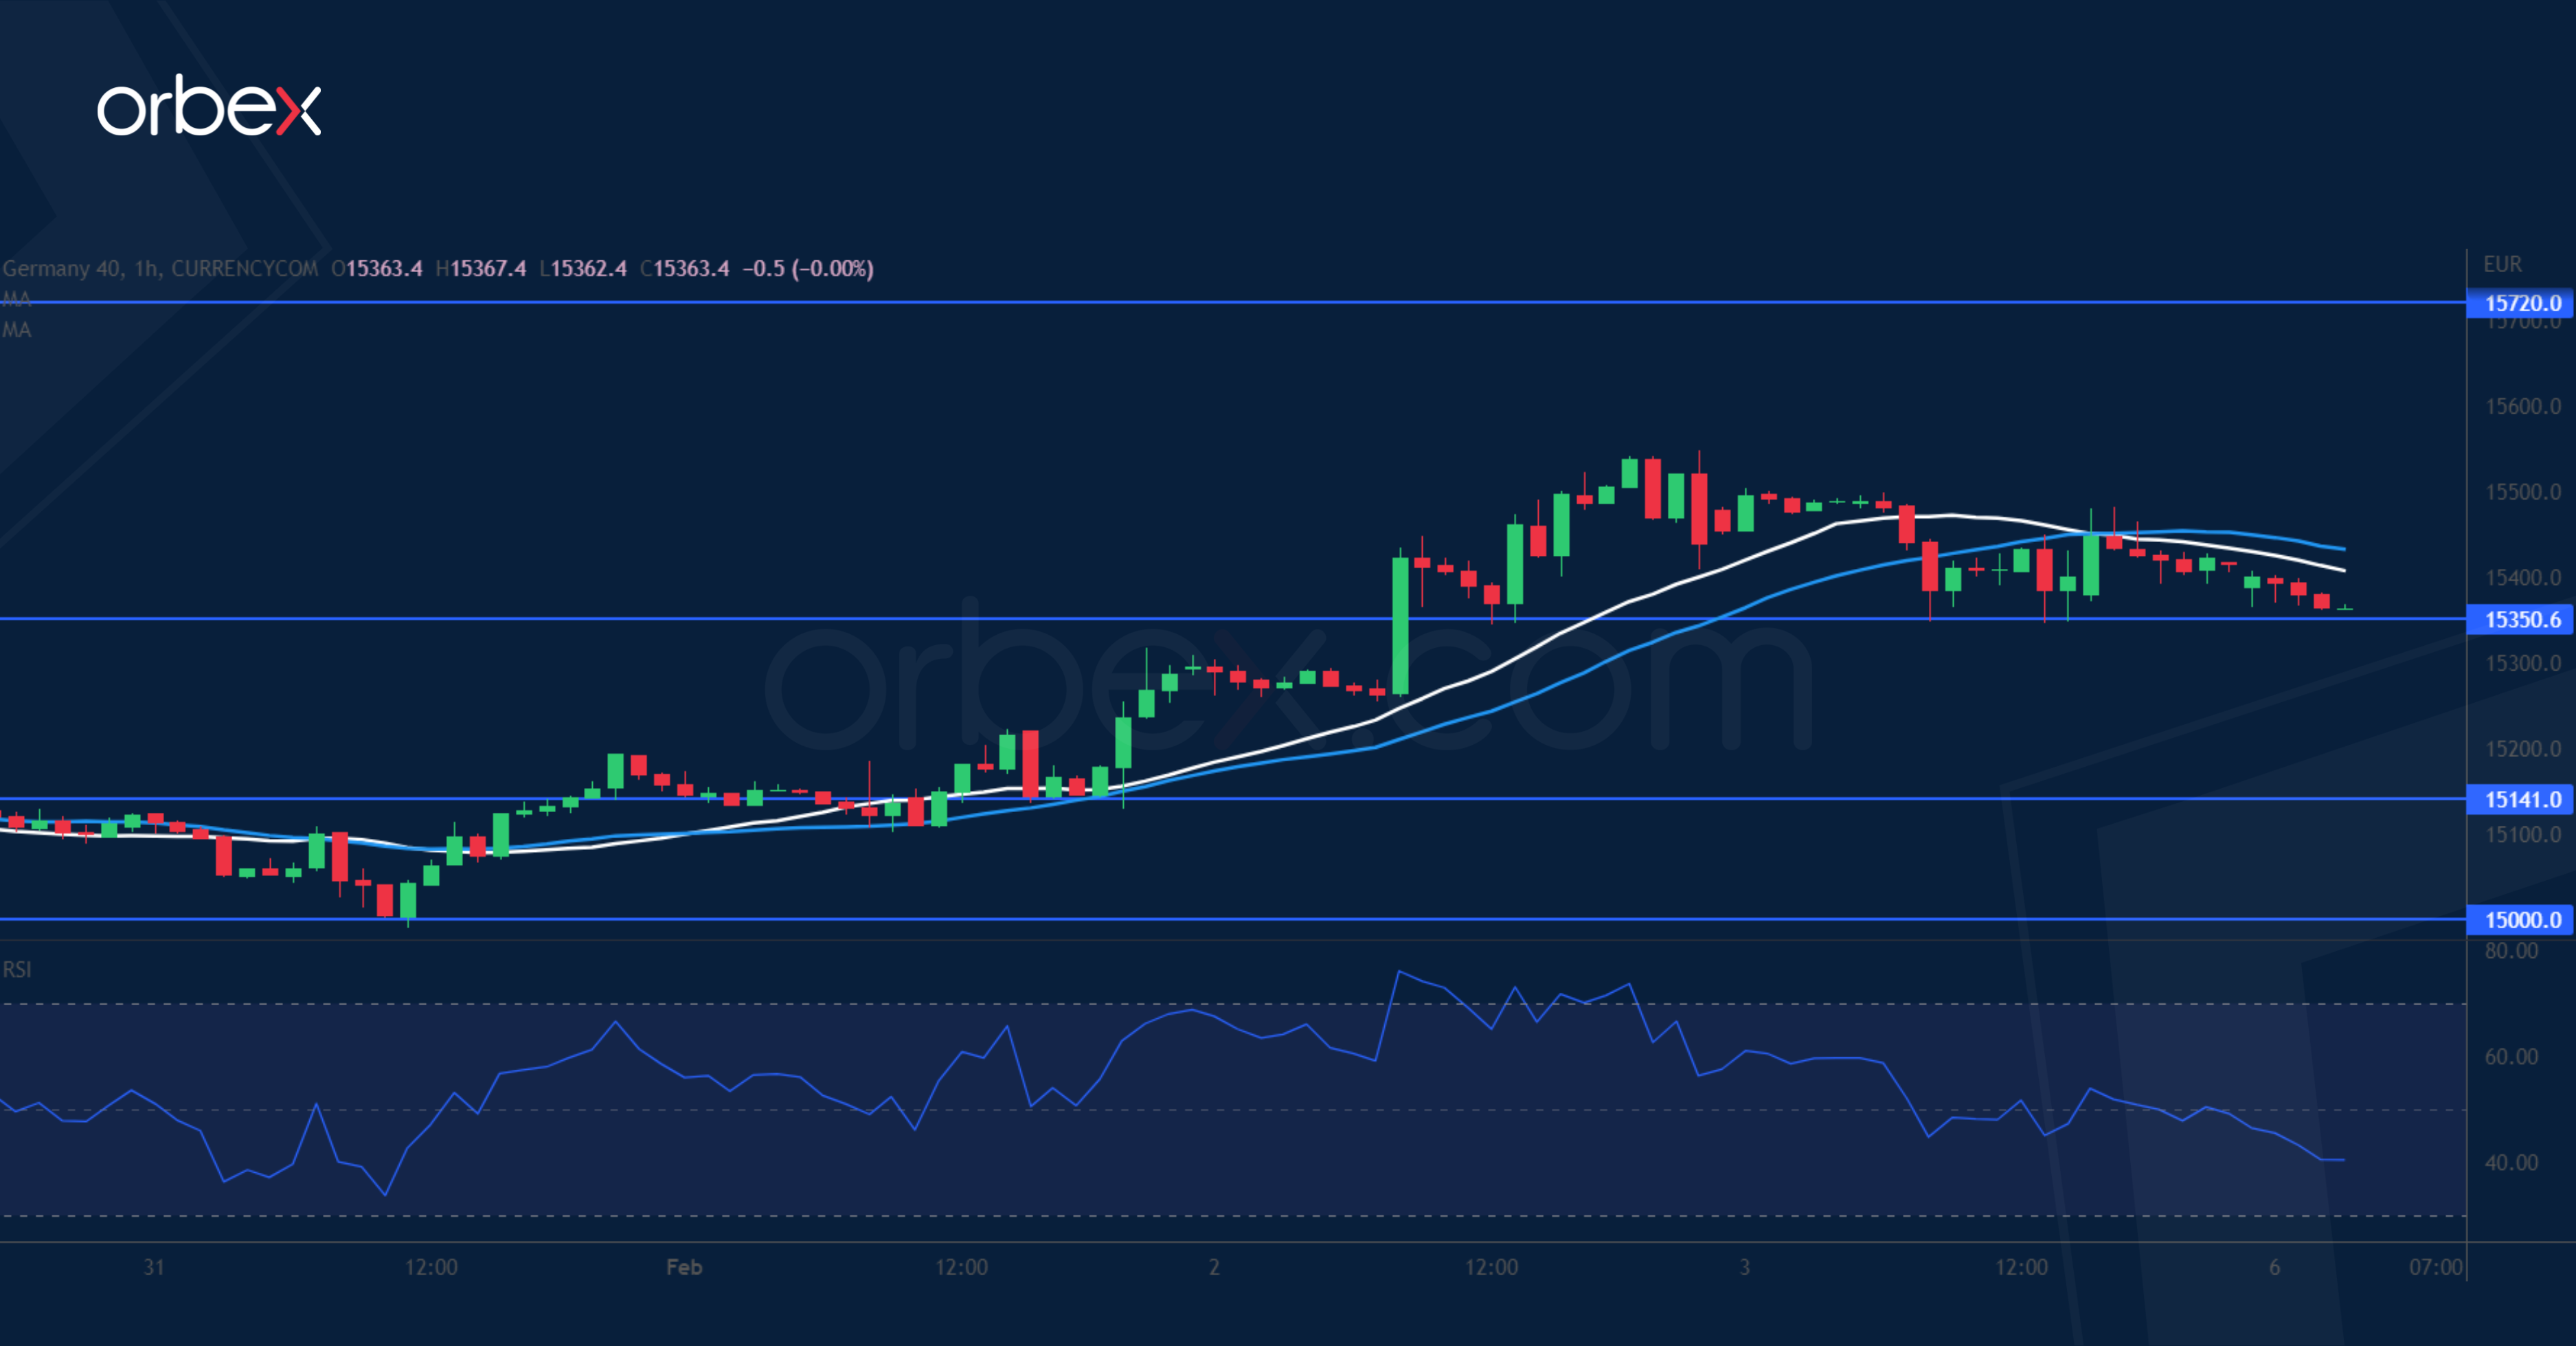
The Dax 40 steadies as investors hope that the ECB is in the later stage of its hiking cycle. Sentiment saw a boost after a bounce off the 20-day SMA (15000), potentially sending the index to a 12-month high (15720). The rally has tempered its pace after an overbought RSI showed signs of overextension. 15350 is the first support and a bounce would carry the bullishness to the aforementioned target. A bearish breakout, however, would force leverage positions out and send the price back to the moving average now at 15140.

