
Orbex would like to introduce our first Elliott Wave analysis where our resident analyst looks at the current WTI cycle.
The WTI (Crude Oil) cycle and current Wave Count is indicating that the up-side movement may not be over yet, and that WTI could reach as high as $70 or even $80 per barrel, in the long run.
Before that may occur, the Wave Count below is suggesting that WTI could show more weakness, possibly towards the previous Bullish Break-out around $54-52 levels.
WTI – Daily Chart:
Elliott Wave Long-Term Analysis:
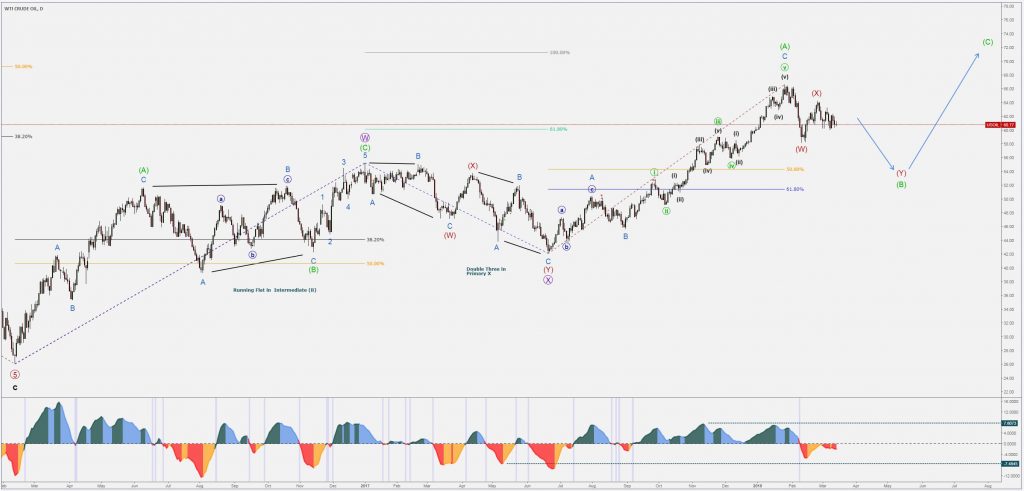
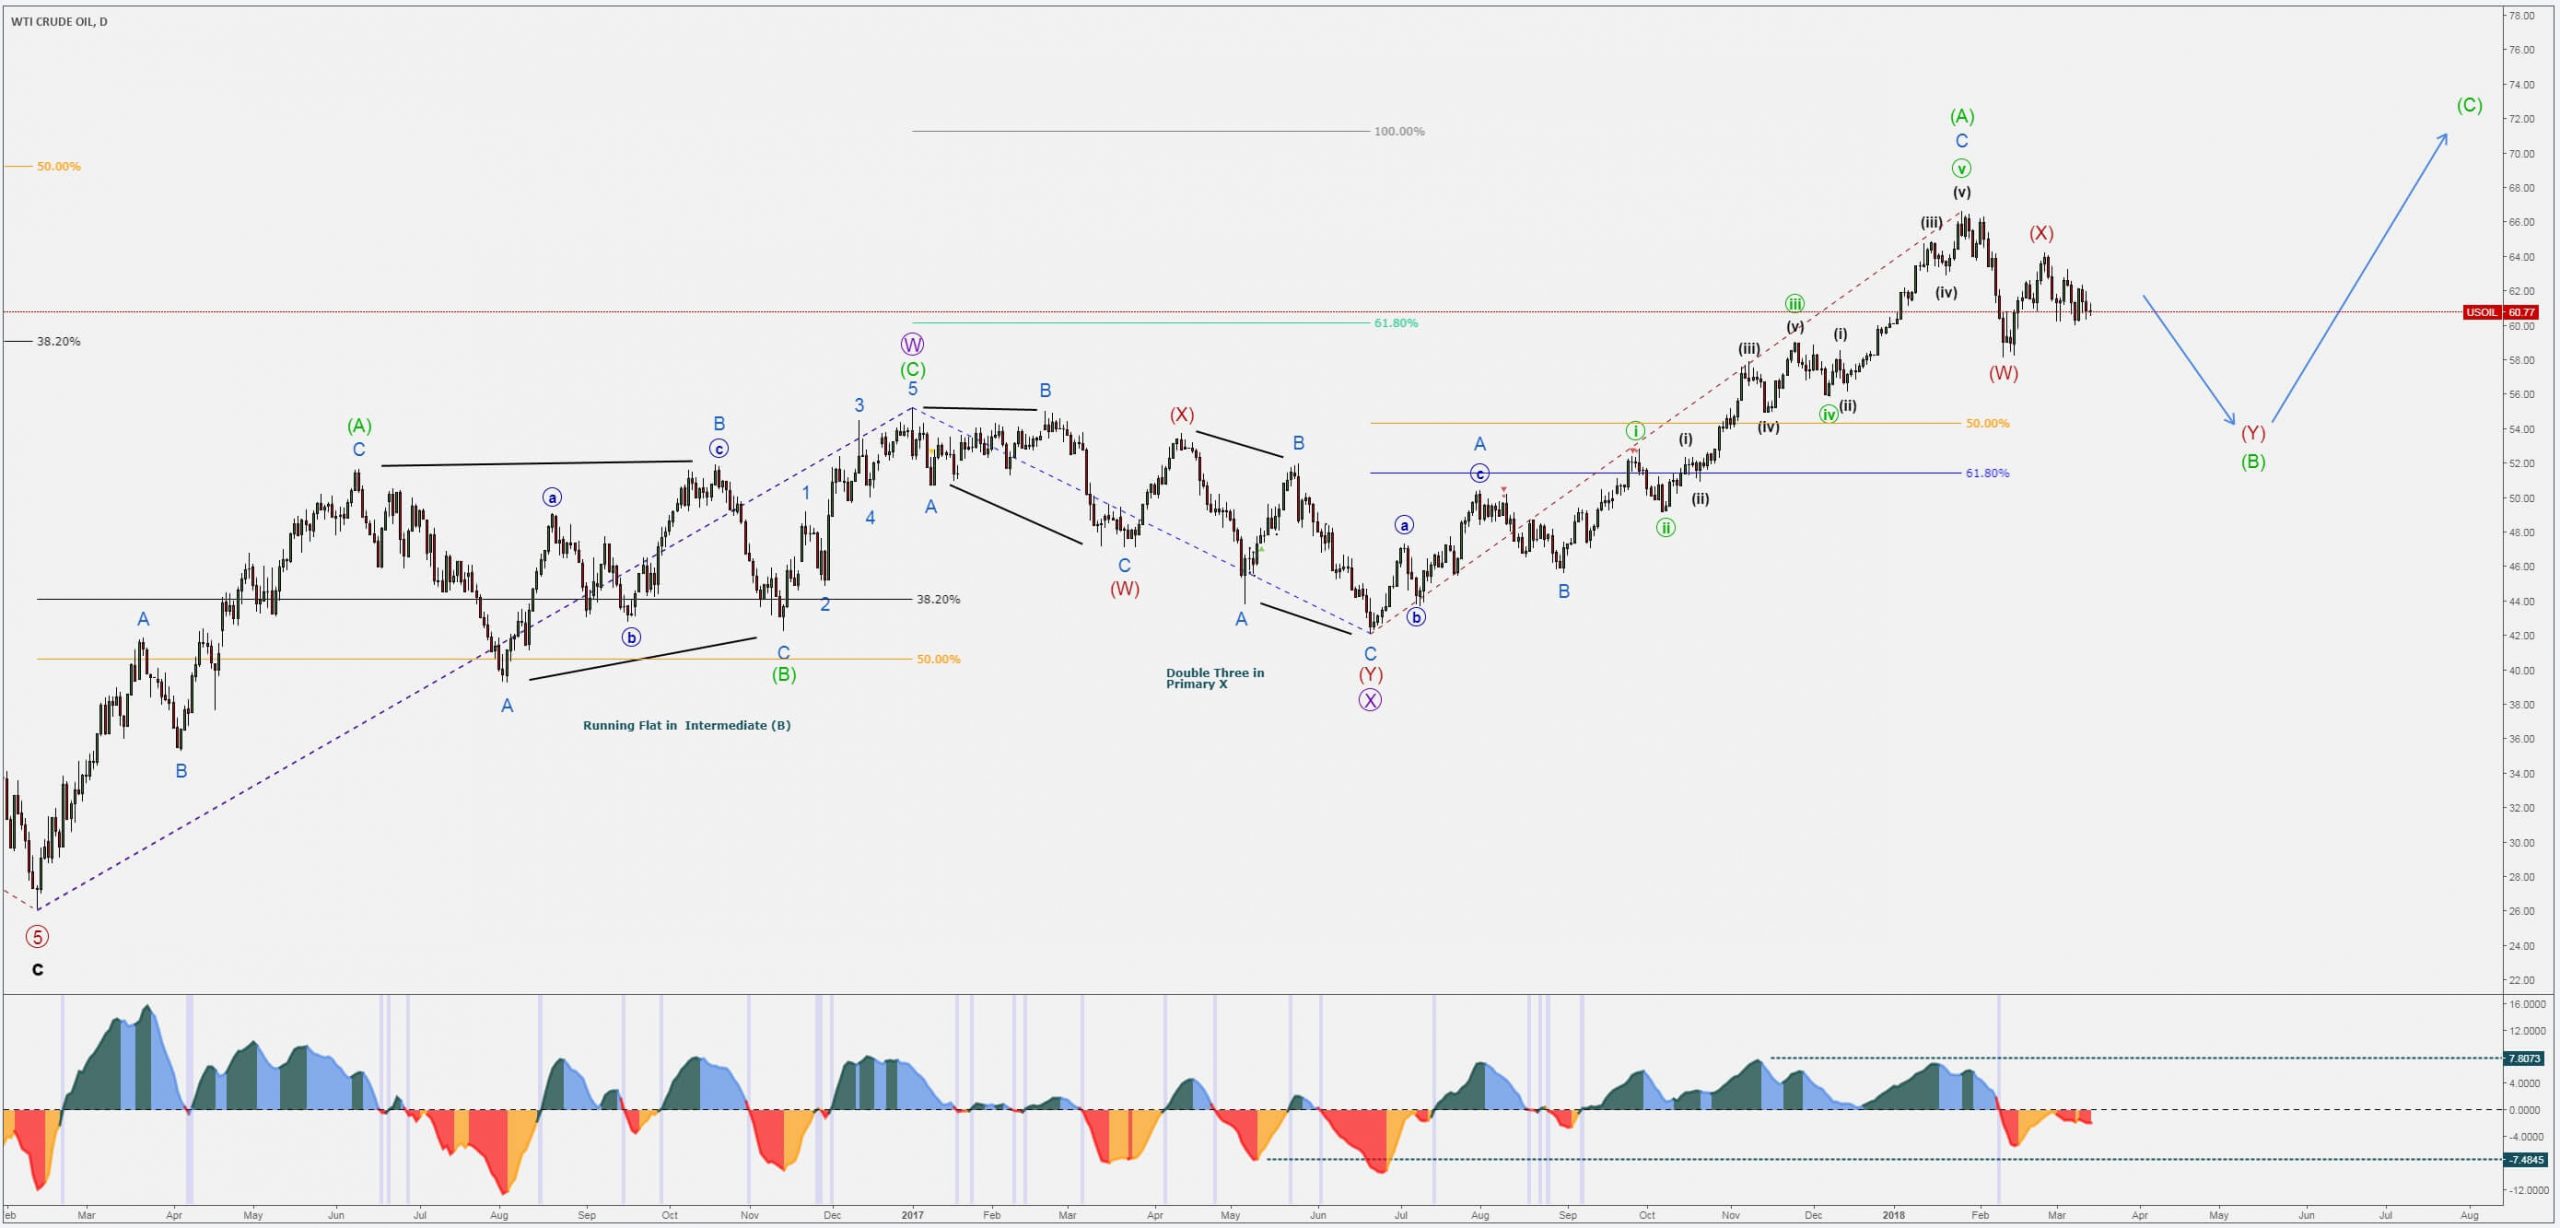
- 11th Feb 2016 low and 3rd Jan 2017 high – These Swings are labeled as Primary W (purple), due to the Complex Patterns and false break-outs noticeable within Intermediate (B) (green).
- 3rd Jan 2017 high and 21st Jun 2017 low – The Complex Corrective Structure is labeled as a Double Three, within Primary X (purple).
- 21st Jun 2017 low until present times – Price Action Rally is labeled as Intermediate (A) (green), with the sustained Rally occurring in Minor C (light blue).
WTI – 4H Chart:
The overall Structure is labeled as a possible Double Three in Intermediate (B) (green) which is showing considerable signs of possible Bearish candles before the Bullish Cycle would be completed.
Elliott Wave Medium-Term Analysis:
- 25th Jan 2018 high and 9th Feb 2018 low – First leg of the projected Double Three Structure, representing Minor W (red), showing a failed Bullish Retracement in Minute X (purple) and an Extension in Bearish Minor Y (purple).
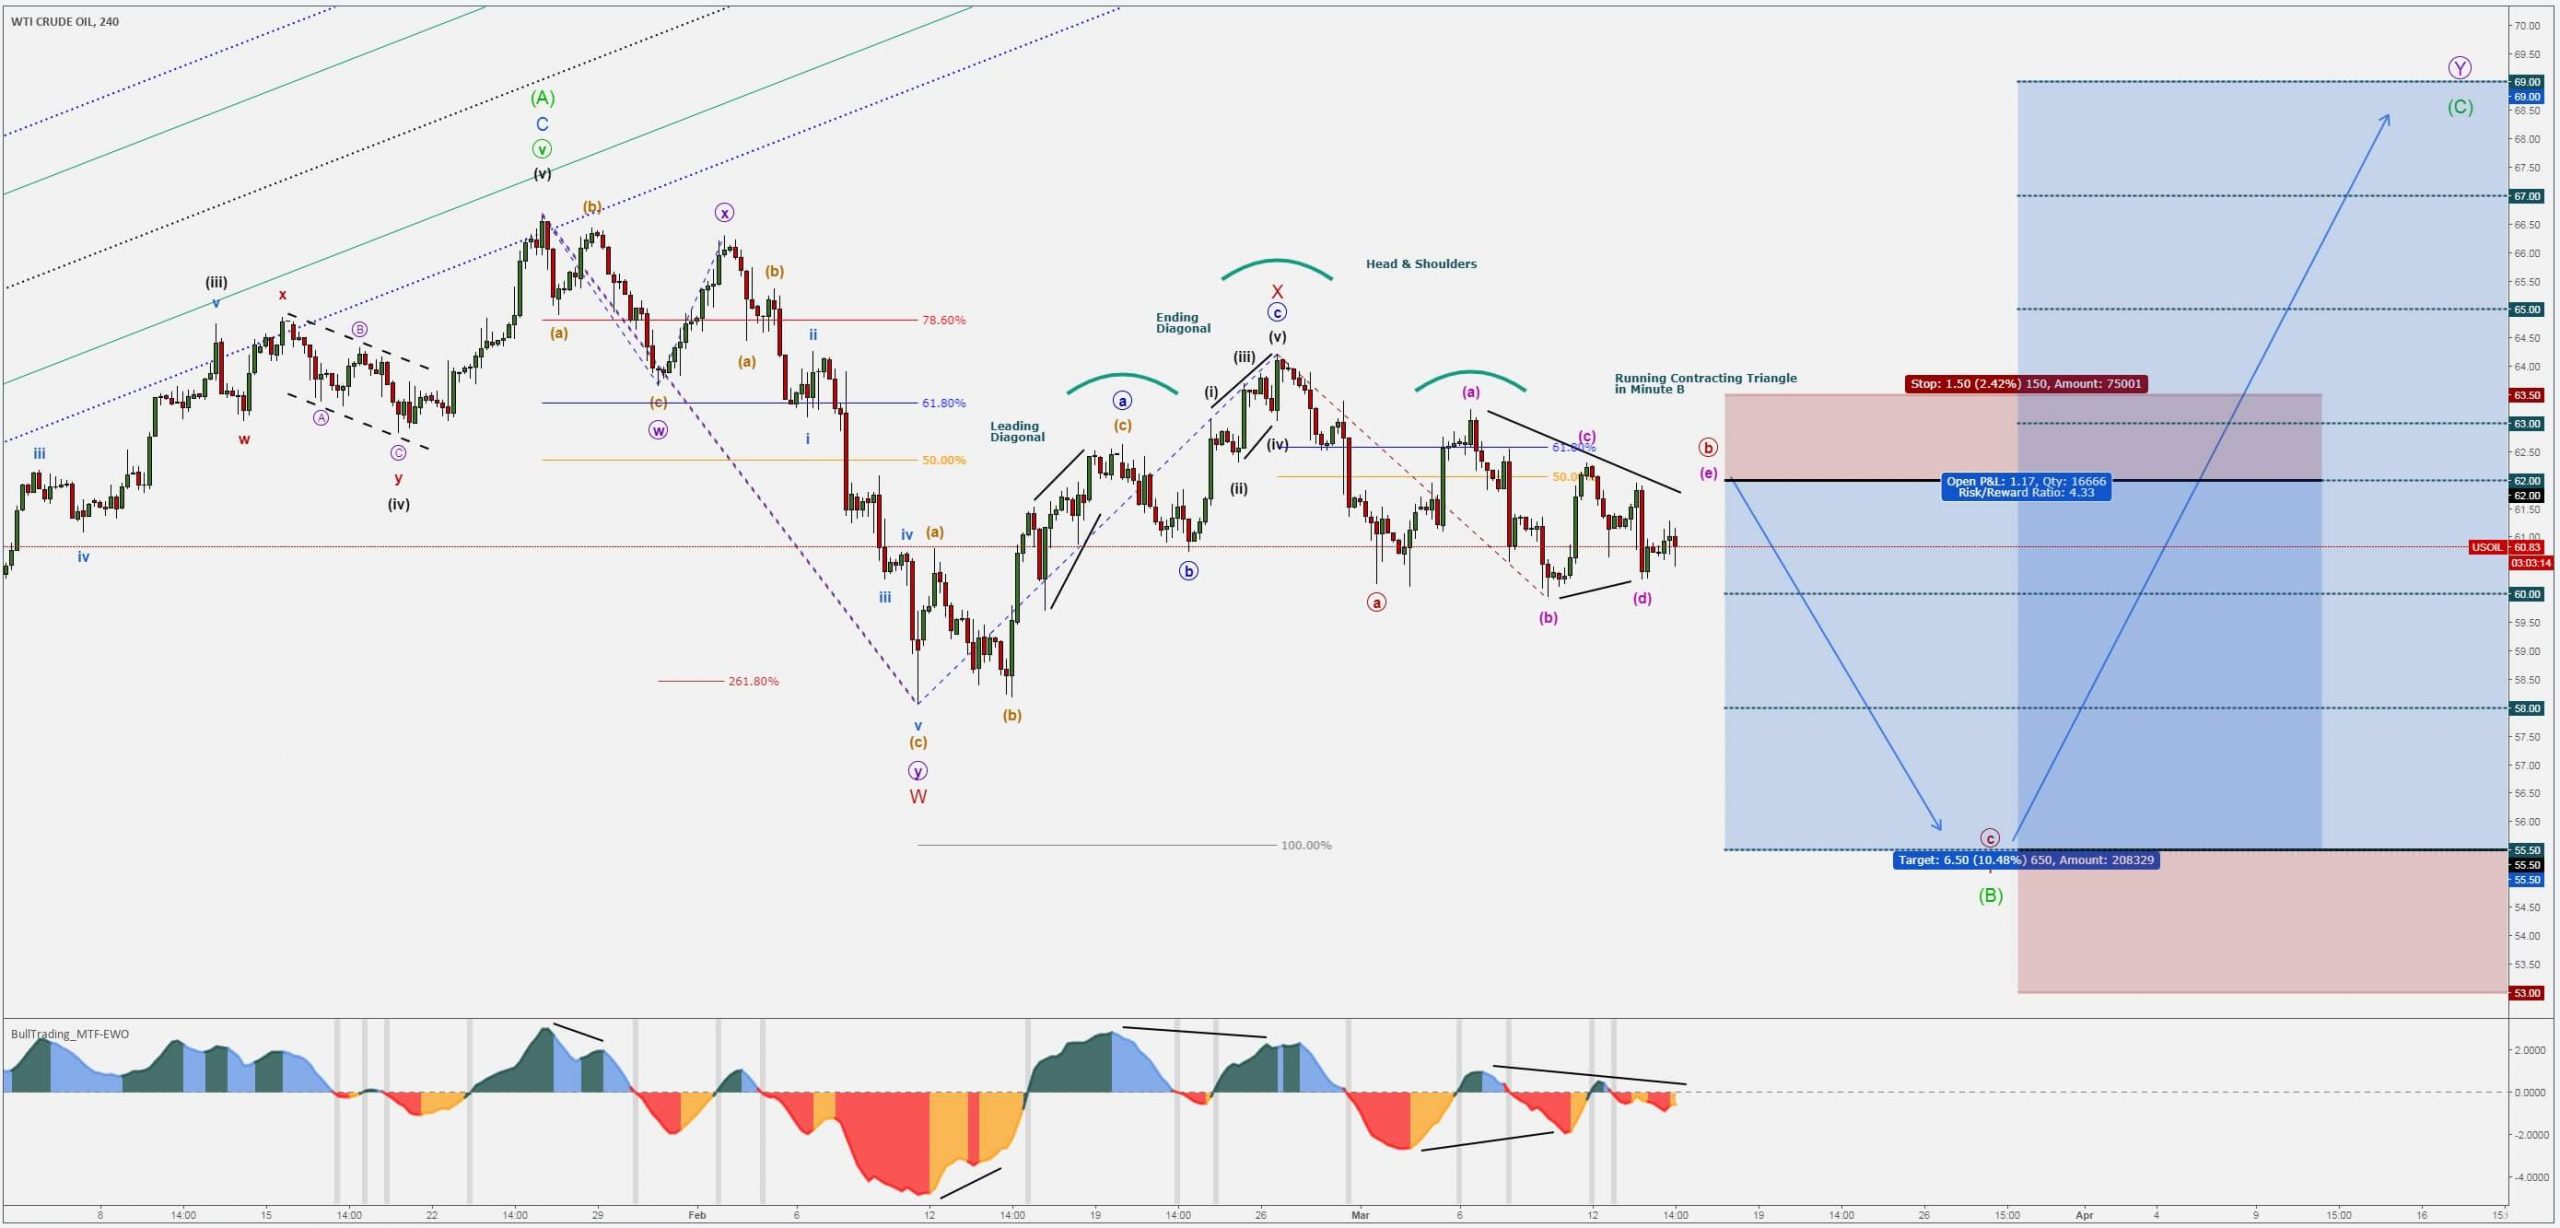
- 9th Feb 2018 low and 26th Feb high – Second leg, viewed as a temporary interruption and as Minor X (red), containing a Leading Diagonal in Minute A (blue) and an Ending Diagonal in Minute C (blue).
- 26th Feb high until present day – Corrective Pattern presents a conflict of degrees and the attempt to correct previous Corrective Structure, hence the reason for the very possible Running Contracting Triangle scenario.
WTI – Running Contracting Triangle Analysis:
- Minute A (red) unfolded with a 5 Swings Sequence, which could indicate that the short-term down-trend could not be over.
- Minute B (red) seems to be unfolding within a Running Contracting Triangle, with Minuette (b) (pink) pushing beyond the start of Minuette (a) (pink).
- Should this scenario be the correct one, Minuette (e) (pink) would complete at or slightly beyond the upper contracting trend-line, not higher than the start of Minuette (a) (pink).
*Other Technical Patterns: possible Head & Shoulders Formation.
WTI – Levels in Focus:
Bearish Scenario:
- 62.00 with Invalidation @ 63.50
- Projected Levels – 60.00 / 58.00 / 55.50
Bullish Scenario:
- 55.50 with Invalidation @ 53.00
- Projected Levels – 58.00 / 60.00 / 63.00 / 65.00 / 67.00 / 69.00
*The present analysis is to be treated as market research and does not constitute investment advice or as a solicitation to trade. Please be aware of the real risk involved by trading financial instruments.
Many pips ahead,
RT