The dollar index is likely to see a minor pullback to 93.0 support ahead of what could be a new leg in the rally to 96 – 96.50 levels as speculators remain net short on the greenback
US retail sales and producer price index data will be the main data points to watch today as the US dollar lingers near a key support level. With prices closing bullish off the 93 handle last week, price action is however still not conclusive of an upside move. Last week’s CFTC data showed that speculators continued to add to net shorts on the US dollar, widening to $6.70 billion a record level since February 2013. For the most part this week, the dollar managed to find support from the BoJ and Japanese government officials rhetoric who continued to jawbone the yen, which in turn has helped the dollar to find support. The dollar remained moderately bid for the last week despite the NFP data coming out soft.
Last week, Goldman Sachs upped its forecasts on the US dollar and noted that the greenback could post as much as a 15% gains from the 93 levels.
US Dollar Technical Outlook

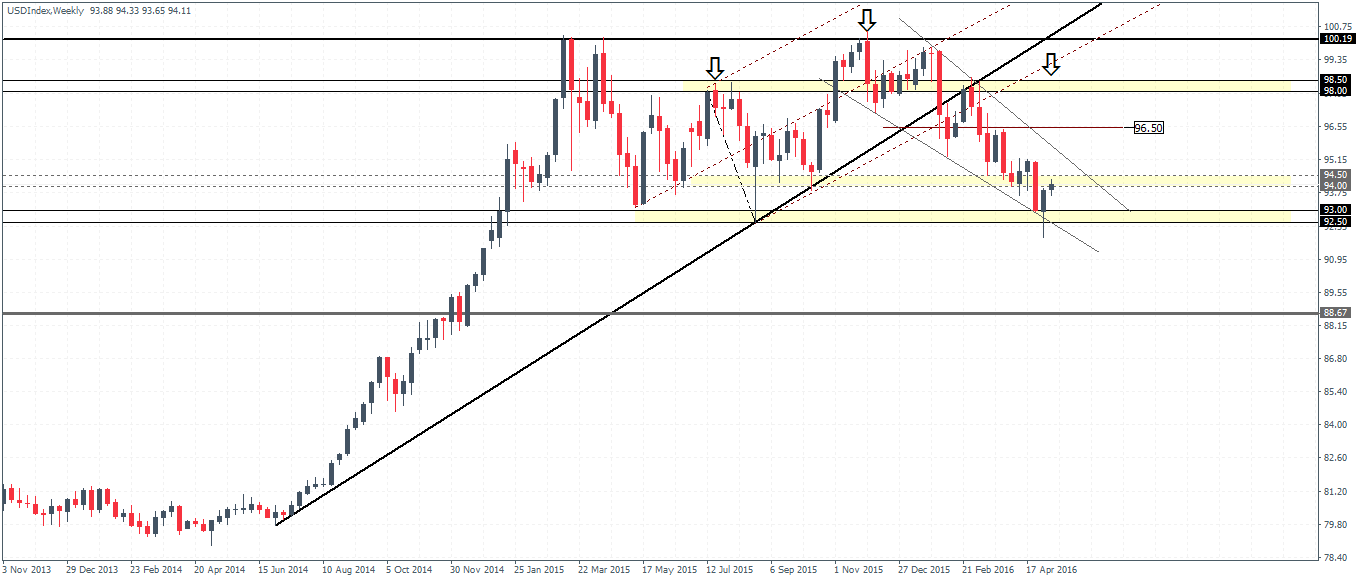
The weekly chart for the US dollar shows price action caught between the range of 92.5 – 93 support and 94.50 – 94.0 resistance. A low has been established at 91.88 or rounding off to 92, and further downside could be seen only on a break below 92. However, the dollar index shows price action likely to be limited to the downside, but for further continuation higher, the resistance needs to be cleared. We continue to maintain the upside bias on the US dollar index for a test to the 96.50 level at the very minimum.
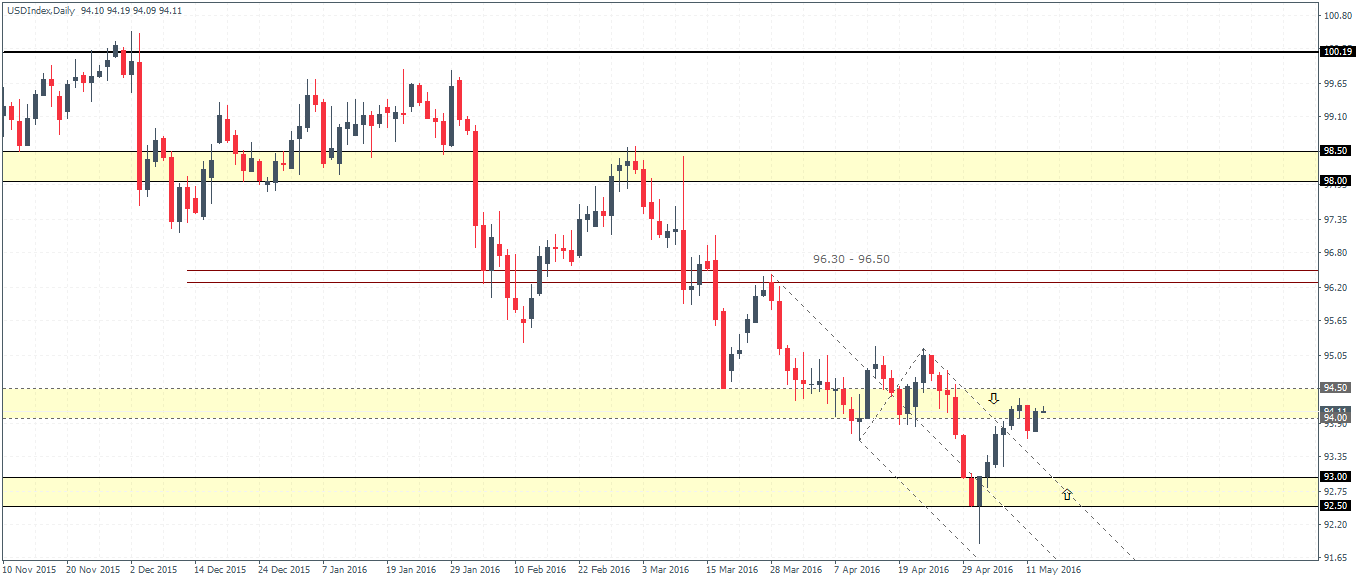
On the daily chart, the price has managed to breakout from the falling median line following the price action near the 92.5 handle. However, for further continuation, we need to see a higher low being posted, which we expect could come in near the 93 levels. The daily chart shows an inside bar forming yesterday so price action from here could be critical. An upside break above the inside bar’s high at 94.22 could see the dollar index test 94.50 resistance with further upside likely only a break above 94.50 and establish support here. Alternately, a dip below 93.65 could see the dollar fall to 93 to post a lower high which validates the move to the upside.
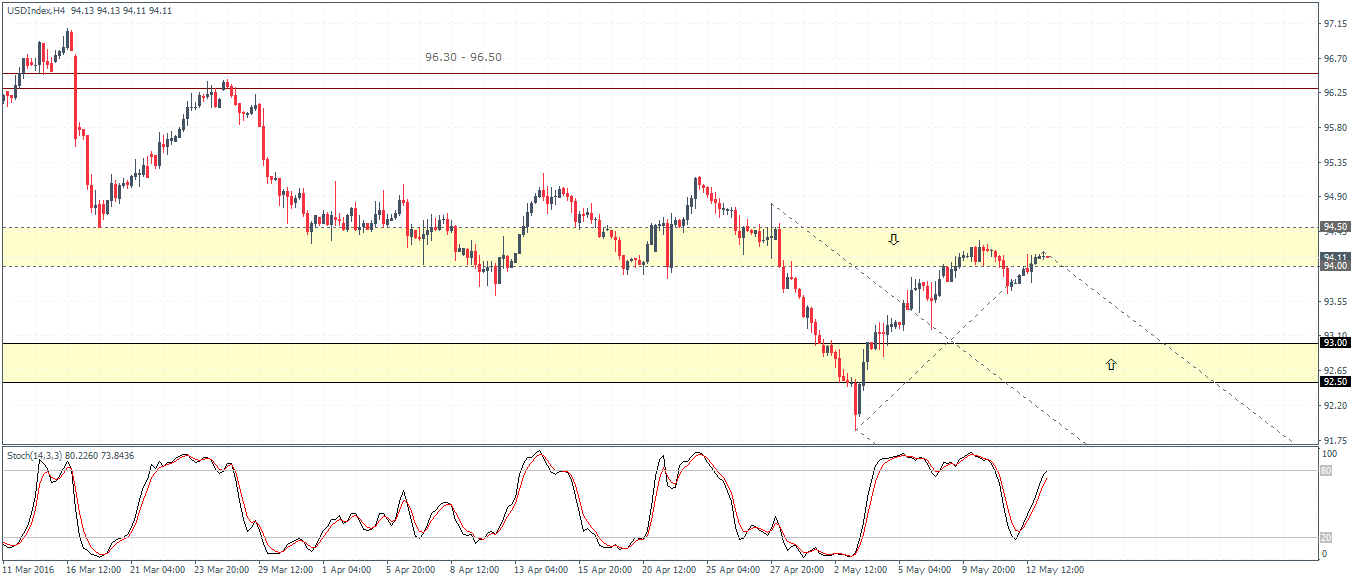
Zooming into the 4-hour chart period, the dollar index is currently forming a bearish divergence with the highs not being validated by the Stochastics. Of course, a close above the recent highs and 94.50 could see new highs coming in, indicating a continuation of the trend, but one which lacks any meaningful pullbacks. While the bearish divergence points to a correction near 93.55, the support level at 93.0 remains bare for a test.