
The Haguro candlestick patterns are one of the unique approaches to trading with price action. It takes a completely different view of the markets and more importantly is confined to the weekly charts alone. This makes analyzing Haguro candlesticks a whole lot easier as most of the analysis can be done over the weekends.
The Haguro method of candlestick analysis was first introduced by Gary Burton CFTe from the Australian School of Technical Analysis. Gary Burton is a well-known name in the financial industry in Australia and has been teaching this method in his Candlestick Master classes.
The Haguro method gained attention after Metastock got the rights to automate this method to show in real time the potential candlesticks that are formed.
If you like price action and prefer the weekly candlesticks, the Haguro method is quite simple and interesting to apply. Perhaps the best part about Haguro method is that it does not interfere with your existing trading systems. Therefore, whether you trade with Bollinger bands or Moving averages, you can still apply the Haguro candlestick analysis to your charts. Of course, the method works on weekly time frames.

What is the Haguro Candlestick pattern?
The Haguro candlestick pattern is simply a way to identify support and resistance levels, but with a different approach. Furthermore, contrary the general opinion of plotting horizontal support and resistance levels at closing or high/low price levels, the Haguro method focuses on the candle’s range, thus making the mid-points of the weekly candlestick as the support and resistance method.
Why analyze weekly charts only?
According to Burton, there is a psychology behind using the weekly time frame. Burton says that after five trading sessions, the Friday’s closing price (and Monday’s opening price) is important as that is where the market decides to settle and reopens after two days of rest.
Plotting the support/resistance lines
In order to plot the support/resistance lines, it is suggested that traders look at the mid-point of the weekly candlesticks (High and Low). Burton suggests that strong bullish or bearish candlesticks which have a significantly higher range than the previous weekly candlesticks are the most important. He calls them “Soldiers in the Battlefield.”
When the midpoint of this soldier candlestick is breached, “it will result in certain death.”
There is a total of 16 candlesticks, categorized into bullish and bearish.


- The first step in the Haguro method is to look for price congestion followed by a wide range candlestick on the weekly chart.
- Mark the mid-point of this wide range candlestick and observe how price reacts the next week or in a few weekly sessions
- Identify if any of the candlesticks after plotting the support and resistance levels are bullish or bearish by comparing to the 16 candlestick patterns shown above
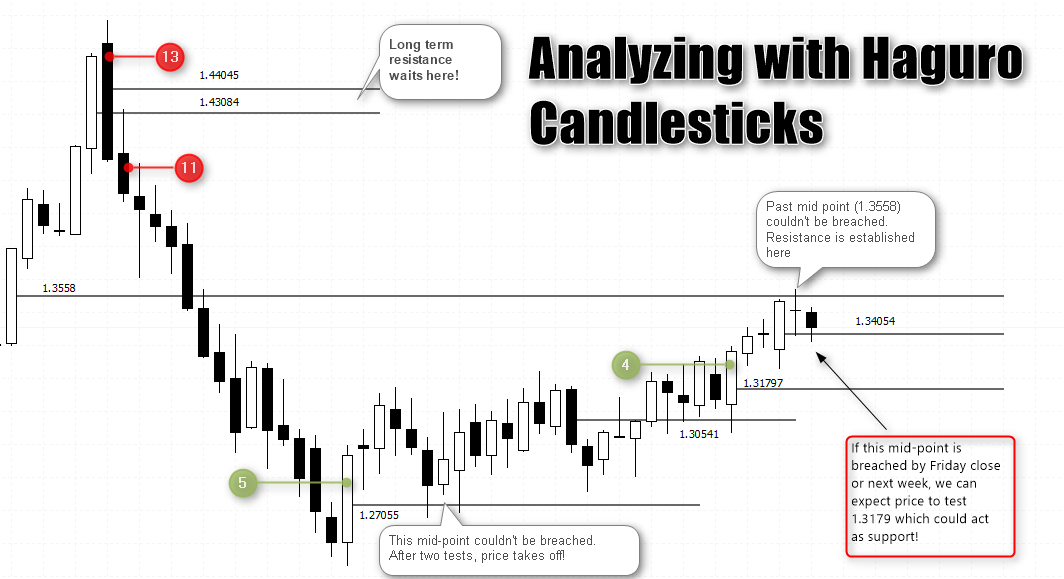
The above chart gives a good example of the Haguro method. Starting from the left:
- Candlestick #13 is bearish and breaches the previous week’s mid-point thus indicating a bearish sentiment. The next week, price barely makes it to the mid-point and closes with candlestick #11, which is your trigger to go short.
- After a steady decline, we see a strong bullish candlestick which is candlestick #5. After plotting the mid-point, you can see that four weeks later, price falls back to this mid-point but fails to breach it (even on another attempt). After this, price starts to drift before pushing higher.
- To the right, another mid-point reference is used, and after a few attempts to break this midpoint at 1.30541, we have a bullish candlestick #4 formed which signals a move to the upside
- Currently, we have the mid-point at 1.3054. This level needs to be breached on a Friday close with Monday opening below the mid-point to confirm a decline… to 1.3179, which is the take profit level
The Haguro Candlestick method takes a bit of time to get used to, but here are some pointers to bear in mind.
- The strongest part of a trading period (strong weekly candlestick) is where the range and body are visibly larger than the preceding weeks, known as the soldier candlestick
- The weakest part of the soldier is the midriff, which if pierced results in certain death (pierce = Friday’s closing price closing below the midriff of the soldier candle) this indicates the support or resistance level has been breached
- The weekly candlestick shapes do not have the same meaning or implication as daily time frame
- The psychology of trading with weekly timeframes is that after 5-days of trading and 2-days of rest, the market knows exactly what it’s doing on the Monday open

![Credit Card 160×600 [EN]](https://assets.iorbex.com/blog/wp-content/uploads/2023/06/13144507/Blog-Banner_EN-Banner_160X600X2.webp)