
USDZAR is set to close a second week with gains although price action on the weekly chart shows an inside bar formed last week, indicating a near term break out from the range. Price action in USDZAR has been limited to a sideways pattern with 14.375 and 13.475 playing the resistance and support levels within the falling price channel.

On the economic front, data this week saw the release of the PPI and updated forecasts from the finance ministry.
Producer prices seen slowing from a year ago

Factory gate inflation was showing a slower pace of increase in prices with the cost of manufacturing seen rising at a slower pace. Data released on Thursday by the Statistics SA showed that the annual percentage change in the PPI for final manufactured goods was 6.6%, slower than 7.2% seen a year before. On a monthly basis, producer prices declined 0.3%.

The PPI data follows last week’s inflation data which saw consumer price index in South Africa rising 6.1% on a year over year basis in September, advancing from 5.90% from the previous month. On a month over month basis, CPI rose by a modest 0.2%, reversing the 0.1% declines previously
Finance Ministry: 2016 growth forecasts lowered
On Wednesday, South Africa’s finance ministry lowered growth forecasts for 2016 and expects that the economy will grow just 0.5% this year and 1.7% in 2017.
The new forecasts are lower from February’s projections of 0.9% for 2016. In the mid-term budget speech, the finance minster said that the government will post a slightly higher budget deficit of 3.4% of GDP for the fiscal year ending March 31, up from 3.2% deficit forecast made previously.
Taxes are also expected to increase in an effort to fend off a potential credit ratings downgrade to Junk. South Africa’s credit ratings are up for review in December with major ratings agencies warning the potential risk for a downgrade. The ratings agencies cited burgeoning debt and government spending as key areas of interest. The additional taxes, details of which are expected to be introduced in February 2017 are expected to raise an additional ZAR43 billion over the next two years.
USDZAR: Challenging the upper trend line from the price channel
The price action on the USDZAR daily chart shows prices reversing after a brief consolidation near 14.375 and the upper trend line of the price channel. The decline off this resistance level has sent USDZAR lower towards 13.765. On the daily chart yesterday, price action closed with a doji which comes after an outside bar was formed.
The price pattern indicates the potential risks to the upside if the dollar manages to close above the doji’s high of 13.982. This could extend the gains towards 14.375, the weekly inside bar’s high. Further upside can be expected only on a daily close above 14.375 and the breakout above the resistance level of 14.73 – 14.65.
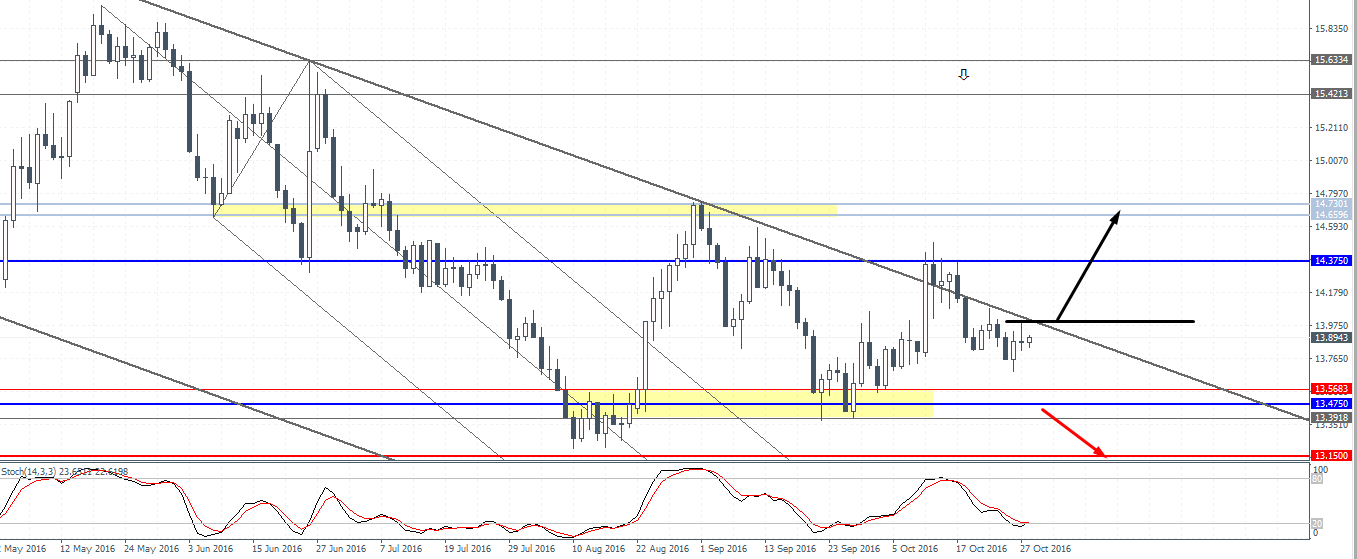
To the downside, USDZAR will likely see the support at 13.475 being challenged once again. A break out below this support could see strong declines coming as the descending triangle pattern could see prices extending the declines towards 12.50 at the very least.
In terms of the immediate catalyst, the US advance GDP report is expected today and followed up by next week’s FOMC meeting, where interest rates are quite likely to be unchanged but the Fed could signal a potential rate hike for December. Next Friday’s nonfarm payrolls will also play a major impact as far as USDZAR is concerned.

