
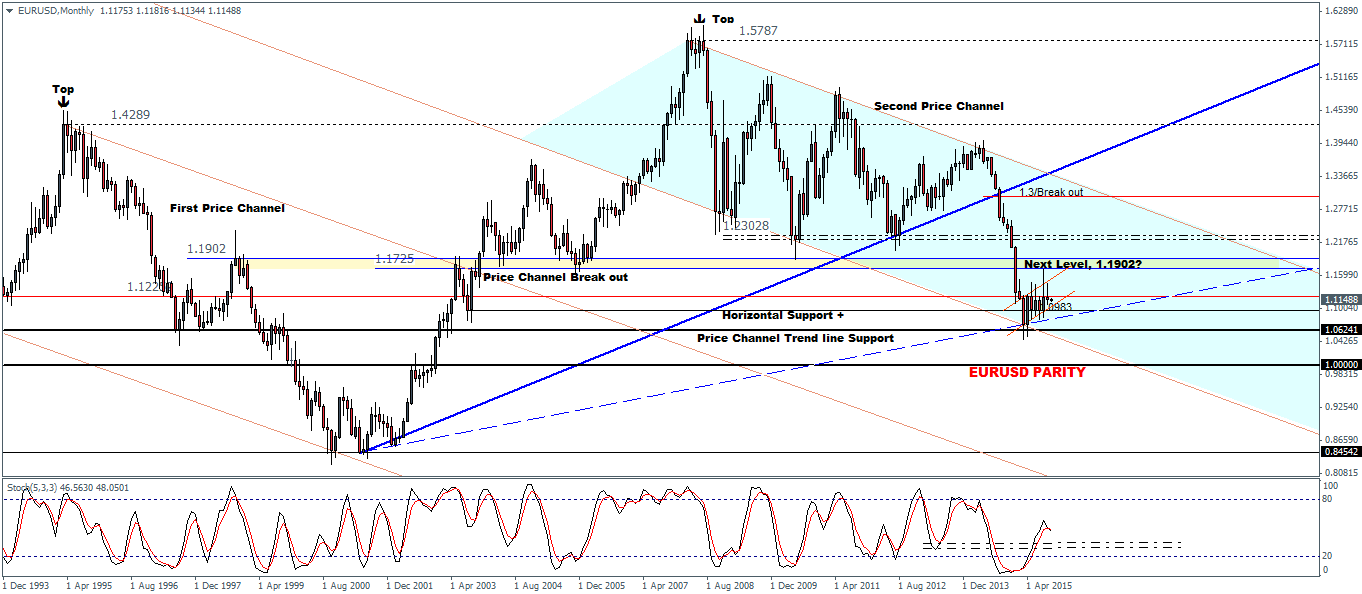
EURUSD (1.114) has been ranging for the past 7 months after prices posted a low to 1.0461 in March this year and the highs to 1.1713 formed in the month of August. While EURUSD parity was the most talked about in the early parts of this year led by the ECB’s QE implementation, as time progressed, the talk about parity has taken a backseat and the monthly chart basically shows the reason why. Prices, on a monthly scale have practically moved sideways after the strong decline off the highs at 1.3905 in April last year.
The sideways market reflects the uncertainty between the US Federal Reserve and the European Central Bank. While the markets expected to see a rate hike in September, the Fed deferred from hiking rates postponing the rate hike decision to any time in the fourth quarter of this year. The ECB on the other hand has been struggling to lift inflation which has remained subdued nearly three quarters after launching the massive quantitative easing program involving purchasing sovereign bonds from the Eurozone. It wasn’t surprising therefore that most of the Fed and ECB officials have embarked on constantly reminding the markets of the diverging monetary policies. It is now only a matter of time as to how long the central bankers can keep up with this narrative, which could lose credibility if it is not followed up by action.
For the moment, the markets are starting to be convinced that the Fed will hike rates at least once in 2015 followed by a gradual increase thereafter. But given the economic conditions that the US economy was in, it is proving to be a difficult task for the markets to be convinced. That should potentially change once the first rate hike is made.

EURUSD is caught between the main support at 1.0624 and the major resistance at 1.19 and 1.1725 level of resistance. The most interesting aspect however is that EURUSD has formed a strong bearish flag pattern on the monthly chart which spells potential downside provided support at 1.0624 gives way. Projecting the measured move, if EURUSD breaks 1.0624 on a monthly level, prices could potentially decline to test the lows of 0.9877 and eventually to 0.8792.
Comparing price action to the Stochastics Oscillator, we notice that while Stochastics posted a lower low around 1.0624 level, the sideways price action resulted in the Stochastics rising from above the oversold level of 20. The pattern potentially points to a bullish corrective divergence on the monthly charts, meaning that we could expect EURUSD to post another low. This expectation builds the basis for EURUSD to possibly test 1.0624 level of support in the near term and could potentially decline lower and range within the 1.0624 and 1.0 levels of support. The bullish stochastic pattern could then see a possible rally towards 1.19 and preferably to as high as 1.23 level. Such a pattern could invalidate the bear flag pattern noted earlier and is one of the risks to bear in mind.
The EURUSD could remain range bound in the near term with the bias for a dip lower high on the cards towards 1.0624 level of support. The bearish technical pattern points to further downside in the long term for EURUSD, but that is something that could take place once the uncertainty involving the Fed’s monetary policy tightening and the ECB’s QE expansion plans are more clear for the markets.

![Credit Card 160×600 [EN]](https://assets.iorbex.com/blog/wp-content/uploads/2023/06/13144507/Blog-Banner_EN-Banner_160X600X2.webp)