
Crude remains range bound amidst volatile trading
Crude Oil futures saw a volatile trading session yesterday on account of the close proximity between the EIA Crude Oil inventories report and the monthly FOMC statement. Oil prices, hence aptly reflected the volatility on account of the two major events being released.
The US Energy Information Administration (EIA) released the weekly Crude Oil inventories, which showed that stockpiles fell by 2.7 million barrels for the week ending June 12th. The dip in the inventories was more than the expected 1.7 million barrels per day. The decline of inventories marked a speedy decline from 6.812 million barrels the week before. Despite the decline, the US Crude oil stockpiles remains at all time highs of 467.9 million barrels per day.
The WTI Crude Oil declined yesterday from daily highs near $61.05, to post a daily low to $59.05 before stabilizing after the FOMC statement.

On the daily charts, prices in Crude Oil have been trading sideways since early May within the range of $62 and $58.66. At the current price of $59.60, Crude oil is close to trading sideways for nearrly 6 weeks in a row. This is aptly reflected in the weekly chart below where we see a series of weekly candlesticks with large wicks and small bodies.
The prolonged sideways price action in Crude Oil is very indicative of a potential break out point being reached any time soon. The weekly chart also points to the risks of an upside breakout which shows price trading quite close to the major long term trend line. A break above this trend line is needed to ascertain any further gains in Crude Oil prices. To the downside, we notice that support is established near $53.5 region.

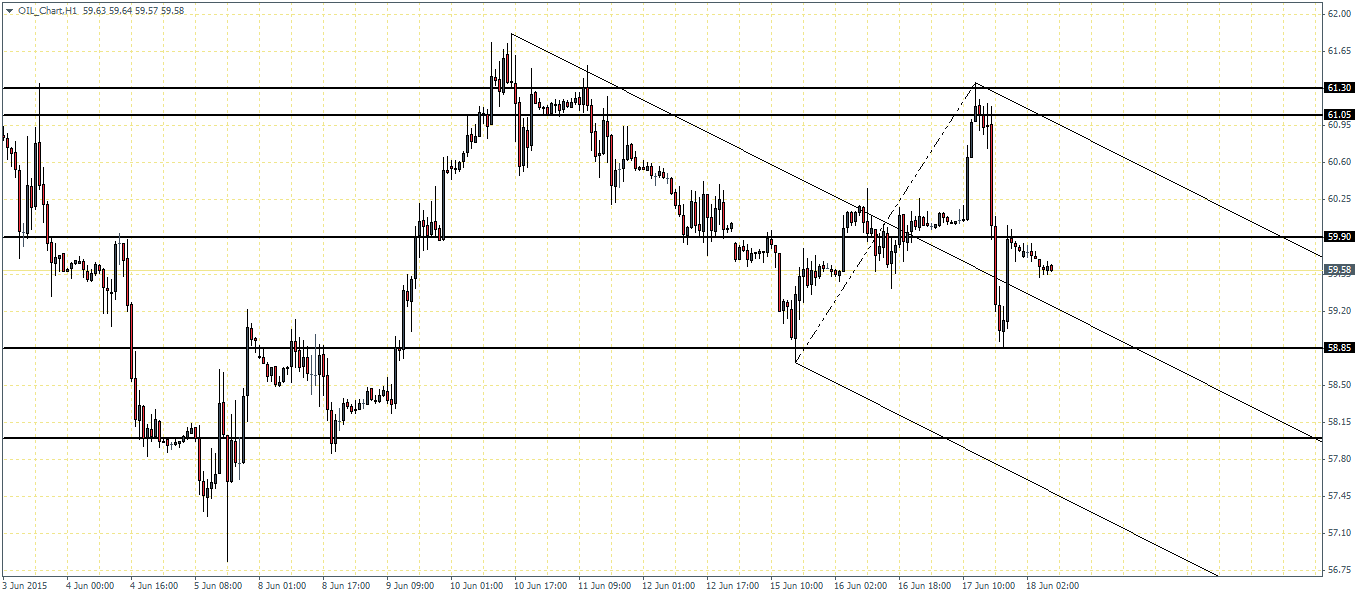
On the 1-hour intraday charts, plotting the Andrew’s Pitchfork, we notice the minor support/resistance levels on the chart. After price briefly broke through the median line, it bounced off from near the lower support at $58.85. Price is now trading close to the $59.9 level of support/resistance. If this level manages to hold the rallies and acts as resistance, Crude Oil could very well see another leg in the decline lower and this time potentially breaking below the previous lows near $58.85. This could eventually give way to the lower end near $58 opening up a potential breakdown from the sideways range.
While there are no major fundamental risks to Crude oil in the near term, the strength of the US Dollar is likely to influence prices for Crude Oil. After yesterday’s FOMC event, which sent the Greenback weaker, today’s economic data includes the US monthly CPI numbers which could bring some volatility to the US Dollar and thus, influence the prices in Crude Oil in the short term.

