Forex – Mid Week Technical Update, 28/05

EURUSD weakened considerably in the past couple of days and as noted in our weekly technical update, price reached to 1.081 levels, a bit below our target area of 1.082. It isn’t surprising to see that yesterday’s candlestick was perhaps the first proper bullish candlestick pattern that was formed after the prolonged weakness in the currency. Today’s price action will be of importance as a bullish close today could possibly start to validate our view that EURUSD could see a bit of an upside in the coming days. However, we need to see a bullish candlestick or a strong close above 1.09 or 1.1 level to re-ascertain this fact.

Should price play out to our expectations it would be very likely that the EURUSD could set itself up for a very interesting rally.
Looking to the RSI level, after the bullish divergence was confirmed, price rallied close to 1.148 and then dropped out of the rising wedge/triangle pattern. The support/resistance level at 1.09 – 1.1 will be now key as a close above this level will no doubt propel EURUSD towards 1.148 and possibly much higher.

However, failure to close above resistance could spell disaster for the Euro as we would shift our bias back to bearish with the previous lows of 1.06 and 1.045 being the next levels to watch in the decline that could persist which will see EURUSD possibly head to parity.

The price level near 1.5476 failed to hold the declines in the GBPUSD despite coming in as a strong support the first time around which saw the Cable rally above 1.565 only to fizzle out and break the support as well. Price action is now trading at 1.532 and this level, should it give way could see GBPUSD turn bearish with the next level at 1.513.
The best option is to possibly look for a test of resistance after 1.532 gives way as support which could seal the deal for a decline to 1.513 as we anticipate further weakness to set in.

We have been mentioning about the symmetrical triangle in USDJPY in the past two analysis. After breaking out from the triangle, price briefly dipped back to test 120.75 the minor resistance level turned support and eventually a rally that broke above 122 and is currently trading above 123.3.
The region between 123.3 through 125 marks a multi-year resistance level and we expect to see quite some choppy price action set in from here on. However, a close below 123.3 will see a decline to test 122 for support and possibly down to 120.75 as well.
Regardless of the price action at the moment, USDJPY will attract lot of buyers into the market making it a prime candidate to buy the dips.
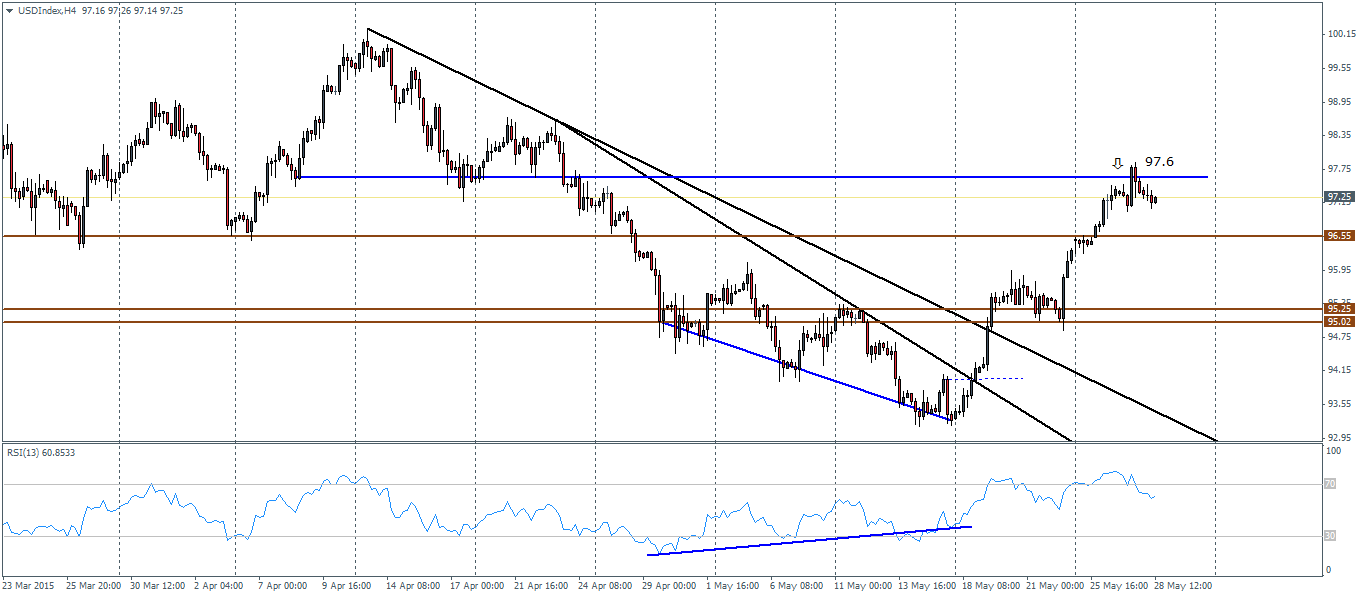
The US Dollar Index has also been in the watch list and as noted 97.6 has acted as resistance with price action failing to break higher and instead printing quite a few bearish candlesticks on the 4-hour chart. Support is at 96.55 and this is where we suspect the US Dollar Index to head to, providing some respite to currencies such as the Aussie, Kiwi and the Euro.

The daily chart for the US Dollar Index is probably the most interesting as price action managed to break above 96.9 support from the daily and formed a doji candlestick yesterday. A bearish close today, below 96.9 will be interesting one to watch as this could potentially spell the end of the correction to the minor downtrend and could in fact pull the Greenback lower.

