
It was only a year ago that we noticed a sharp continuous descent in GBPUSD, around June/July of 2014. We also witnessed a similar descent in Crude Oil prices. Sharp sell off with small pullbacks. So it seems that EURUSD is now the latest currency pair to fall victim to this sharp trend (just as USDCAD has been soaring to new highs).
So what’s in store for the EURUSD now that the single currency looks to edge closer to parity with every passing day?
At the time of writing, EURUSD is currently at 1.0624 and shows to signs of a bounce. The ECB kicked off its QE purchases this Monday, the 9th of March and have started buying bonds from countries such as Germany, Netherlands, Belgium, France to name a few. It is still short of its monthly 60 billion Euro purchase commitment, but it seems like the ECB will find its way to meet the target one way or another.
To understand price action in EURUSD it is probably best to look at the monthly charts given the declines in this pair.

An interesting picture emerges, as can be seen from the chart below.
However, before we get into the details, let’s take a quick recap of the currency pair’s course since 2000.
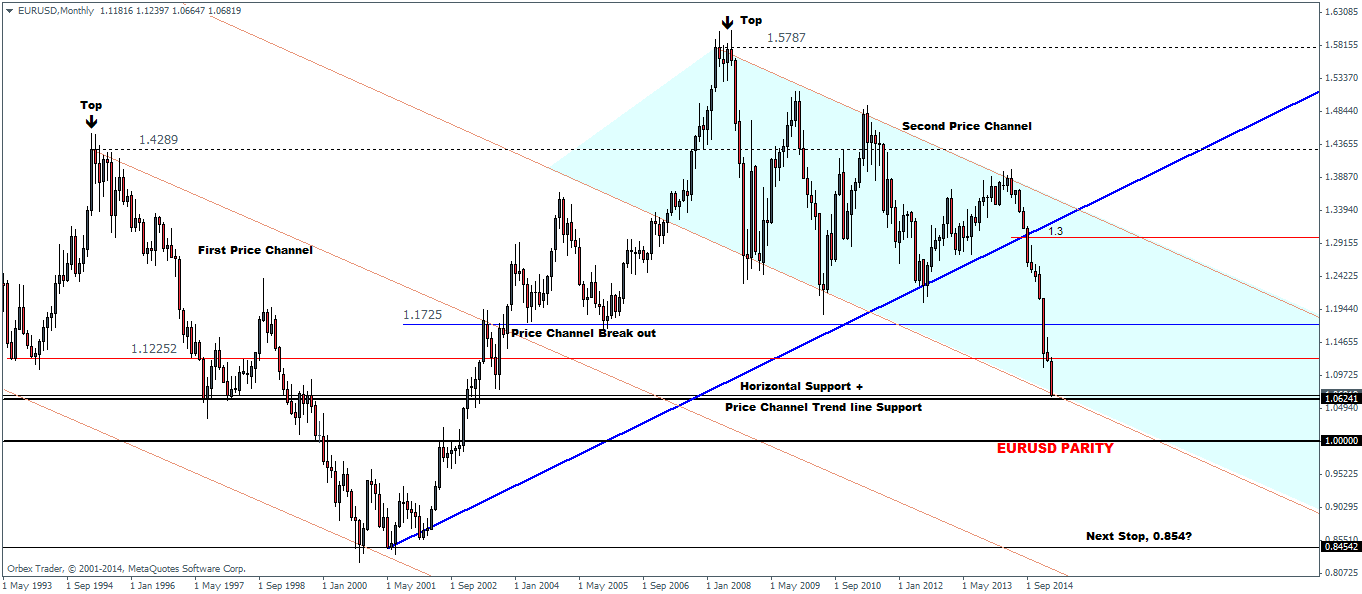
Starting from the left of the chart, EURUSD was in a descent after topping out around 1996. The pair fell to 0.8454 before a leg up ensued. Price eventually broke out from 1.1725 handle and thus broke its long downtrend.
The rally that emerged on the break out of the first price channel at 1.1725 saw a bullish rally with similar momentum push EURUSD all the way to the highs of 1.5787, breaking above its previous established high of 1.4289.
Almost immediately, EURUSD started to decline yet again but seemed to form a support near the 1.1725 zone. The uptrend was still in place but it finally broke away from the 1.3 handle and almost instantly saw a sharp selloff.
Price action is now back at a familiar zone. The 1.062 levels seem to offer some sense of optimism for EURUSD bulls, but it is anyone’s guess that a breach of this level will see a sharp selloff. Who knows… EURUSD might just head back to 0.854 levels.
But before the EURUSD bears start to get excited, there are some points to note at the current level.
Besides 1.062 forming a horizontal support level, it also marks support from the lower trend line of the falling price channel. The combination of these two levels does indeed point to a fact that perhaps… just perhaps EURUSD could take a pause before it resumes its (bearish?) journey again.
Within the scope of the monthly charts, if.. and that is a BIG IF, we do see some kind of bounce taking shape, EURUSD could potentially see a rally back towards 1.12252 to test the minor broken support level for resistance before the bearish momentum could pick up enough steam to break below 1.062 levels. A break above 1.12252 could then set the stage for a correction towards 1.1725.
For those who have missed the boat on EURUSD, it would be wise to stay on the sidelines. Taking new short positions near a support level could prove to be disastrous, especially if you are holding on for the longer term. Alternatively, waiting for a break below 1.062 would be a second option to look into which will open the gates down to parity at 1. Note that a fall to 1.0 could see an immediate reactionary bounce considering how strong the psychological level it turns out to be.
Regardless, it seems like the days of 1.3 or even 1.2 for that matter seem to be a long gone period in EURUSD history.

